RSI Dynamic Divergence Quantitative Strategy

RSI ATR SL/TP risk management DIVERGENCE Pivot
Created on: 2025-04-25 14:57:31 Modified on: 2025-04-25 14:57:31
Copy: 0 Number of hits: 455
avatar of ianzeng123 ianzeng123
2
Follow
319
Followers

 RSI Dynamic Divergence Quantitative Strategy  RSI Dynamic Divergence Quantitative Strategy

Overview

The RSI Dual-Pivot Divergence Quantification Strategy is an advanced trading methodology that identifies potential reversal opportunities by detecting regular bullish and bearish divergences between price action and the Relative Strength Index (RSI). This strategy employs an automated pivot detection algorithm combined with two distinct stop-loss/take-profit management approaches to automatically establish positions when divergence signals are confirmed. The core innovation lies in its precise mathematical validation of price-RSI divergence phenomena and dynamic risk management mechanisms that ensure each trade adheres to predetermined risk-reward ratios.

Strategy Logic

  1. RSI Calculation Module: Utilizes Wilder’s smoothing method to compute 14-period (adjustable) RSI values with close price as default input (configurable).
  2. Pivot Detection:
    • Employs sliding windows of 5 periods (adjustable) on both sides to identify local RSI highs and lows
    • Uses ta.barssince function to ensure 5-60 bar intervals (adjustable range) between pivots
  3. Divergence Confirmation:
    • Bullish divergence: Price makes lower low while RSI forms higher low
    • Bearish divergence: Price makes higher high while RSI forms lower high
  4. Trade Execution System:
    • Dual-mode stop-loss: Based on recent 20-period (adjustable) swing points or ATR volatility
    • Dynamic take-profit: Calculated as risk amount multiplied by preset reward-risk ratio (default 2:1)
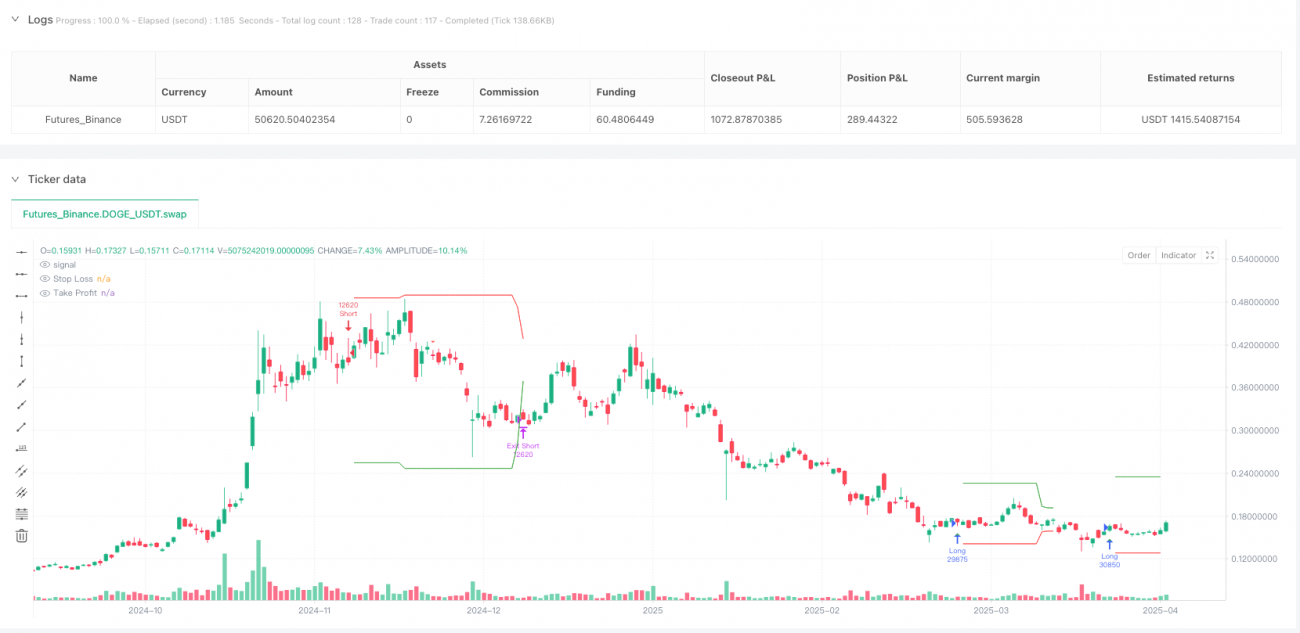
  5. Visualization System: Marks all valid divergence signals on chart and displays real-time stop-loss (red) and take-profit (green) levels for open positions.

Advantages

  1. Multi-dimensional Validation: Requires both price and RSI to meet specific patterns within preset time ranges, significantly reducing false signals.
  2. Adaptive Risk Management:
    • Swing mode suits trending markets for capturing wave movements
    • ATR mode adapts to ranging markets with volatility-based stops
  3. High Customizability: All critical parameters (RSI period, pivot range, risk-reward ratio etc.) adjustable for market conditions.
  4. Scientific Position Sizing: Default 10% capital allocation prevents overexposure in single trades.
  5. Visual Feedback: Real-time chart markings and dynamic stop/take-profit lines provide intuitive decision support.

Risks

  1. Lag Risk: RSI as lagging indicator may generate delayed signals during strong trends. Mitigation: Add trend filters or shorten RSI period.
  2. Whipsaw Risk: May produce consecutive false signals in choppy markets. Mitigation: Use ATR mode with higher multipliers or add volatility filters.
  3. Overfitting Risk: Parameter sets may perform well historically but fail live. Mitigation: Conduct multi-period multi-asset stress tests.
  4. Gap Risk: Price gaps may bypass stops. Mitigation: Avoid trading around major economic events or use options hedging.
  5. Timeframe Dependency: Performance varies across timeframes. Mitigation: Thorough backtesting on target timeframe.

Optimization Directions

  1. Composite Verification: Add MACD or volume indicators for secondary confirmation.
  2. Dynamic Parameters: Auto-adjust RSI period and ATR multiplier based on market volatility.
  3. Machine Learning: Apply genetic algorithms to optimize parameter combinations.
  4. Multi-Timeframe Analysis: Incorporate higher timeframe trend filters.
  5. Dynamic Position Sizing: Adjust trade size based on volatility for risk parity.
  6. Event Filters: Integrate economic calendar to avoid trading around major news.

Conclusion

The RSI Dual-Pivot Divergence Quantification Strategy provides a structured approach to reversal trading through systematic divergence identification and rigorous risk management. Its core value lies in transforming traditional technical analysis concepts into quantifiable trading rules with dual-mode stop mechanisms adaptable to varying market conditions. Strategy excellence requires three key elements: appropriate parameter optimization, strict risk control, and consistent execution discipline. Particularly effective in moderately volatile, non-extreme trending environments, this strategy serves as an excellent template for intermediate traders transitioning to quantitative trading methodologies.
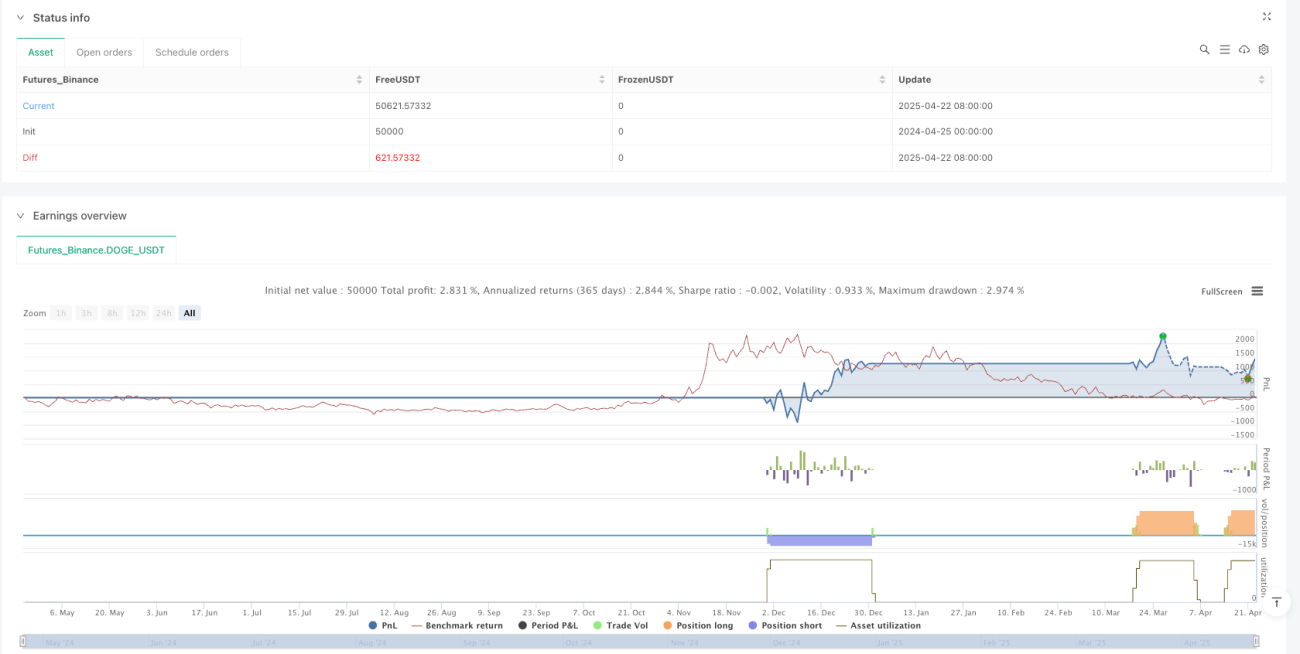
Strategy source code
/*backtest
start: 2024-04-25 00:00:00
end: 2025-04-23 08:00:00
period: 1d
basePeriod: 1d
exchanges: [{"eid":"Futures_Binance","currency":"DOGE_USDT"}]
*/

//@version=6
strategy("RSI Divergence Strategy - AliferCrypto", overlay=true, default_qty_type=strategy.percent_of_equity, default_qty_value=10)

// === RSI Settings ===
rsiLength      = input.int(14, minval=1, title="RSI Length", group="RSI Settings", tooltip="Number of periods for RSI calculation")
rsiSource      = input.source(close, title="RSI Source", group="RSI Settings", tooltip="Price source used for RSI calculation")

// === Divergence Settings ===
lookLeft       = input.int(5, minval=1, title="Pivot Lookback Left", group="Divergence Settings", tooltip="Bars to the left for pivot detection")
lookRight      = input.int(5, minval=1, title="Pivot Lookback Right", group="Divergence Settings", tooltip="Bars to the right for pivot detection")
rangeLower     = input.int(5, minval=1, title="Min Bars Between Pivots", group="Divergence Settings", tooltip="Minimum bars between pivots to validate divergence")
rangeUpper     = input.int(60, minval=1, title="Max Bars Between Pivots", group="Divergence Settings", tooltip="Maximum bars between pivots to validate divergence")

// === SL/TP Method ===
method         = input.string("Swing", title="SL/TP Method", options=["Swing", "ATR"], group="SL/TP Settings", tooltip="Choose between swing-based or ATR-based stop and target")

// === Swing Settings ===
swingLook      = input.int(20, minval=1, title="Swing Lookback (bars)", group="Swing Settings", tooltip="Bars to look back for swing high/low")
swingMarginPct = input.float(1.0, minval=0.0, title="Swing Margin (%)", group="Swing Settings", tooltip="Margin around swing levels as percentage of price")
rrSwing        = input.float(2.0, title="R/R Ratio (Swing)", group="Swing Settings", tooltip="Risk/reward ratio when using swing-based method")

// === ATR Settings ===
atrLen         = input.int(14, minval=1, title="ATR Length", group="ATR Settings", tooltip="Number of periods for ATR calculation")
atrMult        = input.float(1.5, minval=0.1, title="ATR SL Multiplier", group="ATR Settings", tooltip="Multiplier for ATR-based stop loss calculation")
rrAtr          = input.float(2.0, title="R/R Ratio (ATR)", group="ATR Settings", tooltip="Risk/reward ratio when using ATR-based method")

// === RSI Calculation ===
_d    = ta.change(rsiSource)
up    = ta.rma(math.max(_d, 0), rsiLength)
down  = ta.rma(-math.min(_d, 0), rsiLength)
rsi   = down == 0 ? 100 : up == 0 ? 0 : 100 - (100 / (1 + up / down))

// === Divergence Detection ===
defPl      = not na(ta.pivotlow(rsi, lookLeft, lookRight))
defPh      = not na(ta.pivothigh(rsi, lookLeft, lookRight))
rsiAtRR   = rsi[lookRight]
barsPl    = ta.barssince(defPl)
barsPl1   = barsPl[1]
inRangePL = barsPl1 >= rangeLower and barsPl1 <= rangeUpper
barsPh    = ta.barssince(defPh)
barsPh1   = barsPh[1]
inRangePH = barsPh1 >= rangeLower and barsPh1 <= rangeUpper
prevPlRsi   = ta.valuewhen(defPl, rsiAtRR, 1)
prevPhRsi   = ta.valuewhen(defPh, rsiAtRR, 1)
prevPlPrice = ta.valuewhen(defPl, low[lookRight], 1)
prevPhPrice = ta.valuewhen(defPh, high[lookRight], 1)
bullCond    = defPl and low[lookRight] < prevPlPrice and rsiAtRR > prevPlRsi and inRangePL
bearCond    = defPh and high[lookRight] > prevPhPrice and rsiAtRR < prevPhRsi and inRangePH

plotshape(bullCond, title="Bullish Divergence", style=shape.triangleup, location=location.belowbar, color=color.green, size=size.tiny)
plotshape(bearCond, title="Bearish Divergence", style=shape.triangledown, location=location.abovebar, color=color.red, size=size.tiny)

// === Entries ===
if bullCond
    strategy.entry("Long", strategy.long)
if bearCond
    strategy.entry("Short", strategy.short)

// === Pre-calculate SL/TP components ===
swingLow    = ta.lowest(low, swingLook)
swingHigh   = ta.highest(high, swingLook)
atrValue    = ta.atr(atrLen)

// === SL/TP Calculation & Exits ===
var float slPrice = na
var float tpPrice = na
var float rr      = na

// Long exits
if strategy.position_size > 0
    entryPrice = strategy.position_avg_price
    if method == "Swing"
        slPrice := swingLow * (1 - swingMarginPct / 100)
        rr      := rrSwing
    else
        slPrice := entryPrice - atrValue * atrMult
        rr      := rrAtr
    risk     = entryPrice - slPrice
    tpPrice  := entryPrice + risk * rr
    strategy.exit("Exit Long", from_entry="Long", stop=slPrice, limit=tpPrice)

// Short exits
if strategy.position_size < 0
    entryPrice = strategy.position_avg_price
    if method == "Swing"
        slPrice := swingHigh * (1 + swingMarginPct / 100)
        rr      := rrSwing
    else
        slPrice := entryPrice + atrValue * atrMult
        rr      := rrAtr
    risk     = slPrice - entryPrice
    tpPrice  := entryPrice - risk * rr
    strategy.exit("Exit Short", from_entry="Short", stop=slPrice, limit=tpPrice)

// === Plot SL/TP Levels ===
plot(strategy.position_size != 0 ? slPrice : na, title="Stop Loss", style=plot.style_linebr, color=color.red)
plot(strategy.position_size != 0 ? tpPrice : na, title="Take Profit", style=plot.style_linebr, color=color.green)

// === Alerts ===
alertcondition(bullCond, title="Bull RSI Divergence", message="Bullish RSI divergence detected")
alertcondition(bearCond, title="Bear RSI Divergence", message="Bearish RSI divergence detected")