
Overview
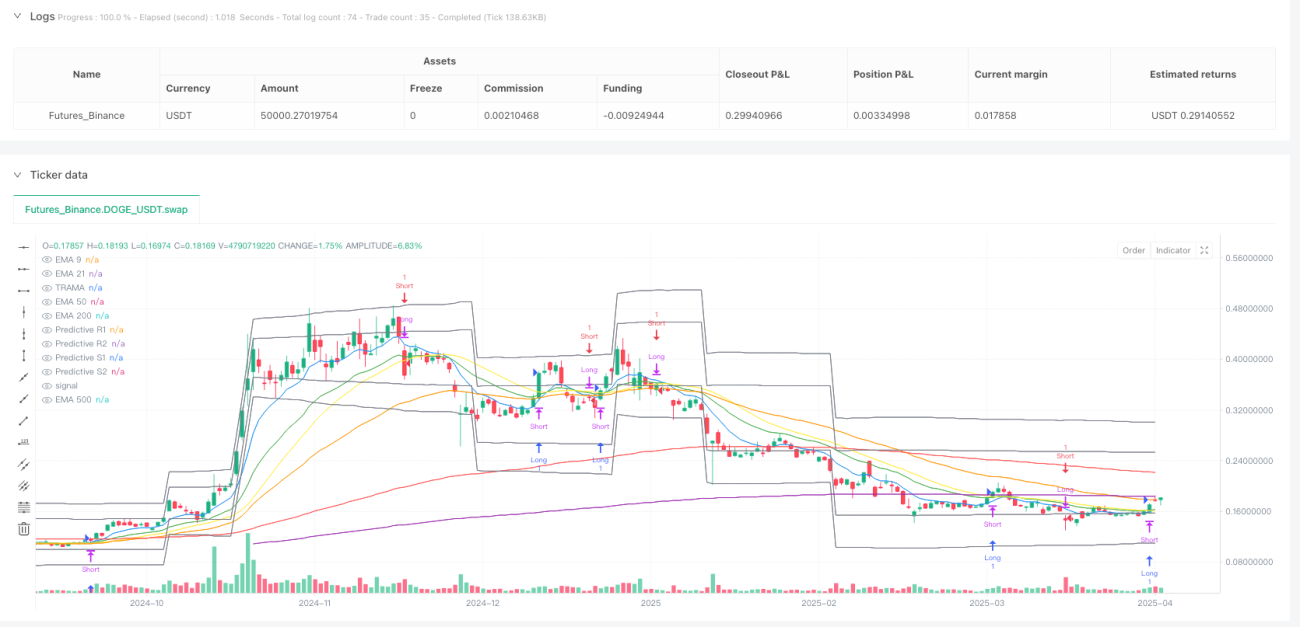
This strategy is a trend following trading system that combines multiple moving averages and technical indicators, primarily using Exponential Moving Averages (EMA), Relative Strength Index (RSI), and Moving Average Convergence Divergence (MACD) to determine market trend direction and execute trades. The strategy also incorporates Triple Exponential Moving Average (TRAMA) and Average True Range (ATR)-based price channels to provide a more comprehensive market analysis perspective and risk management tools.
Strategy Principles
The core principle of this strategy is to identify strong trends and filter false signals through cross-validation of multiple technical indicators. Specifically:
-
Multi-period EMA System: The strategy employs five EMAs with different periods (9, 21, 50, 200, and 500), forming a complete multi-timeframe analysis system. Short-term EMAs (9 and 21) are used to trigger trading signals, while medium to long-term EMAs (50, 200, and 500) confirm the overall market trend.
-
MACD Momentum Confirmation: The MACD indicator (parameters 12,26,9) measures price momentum. When the MACD line crosses above the signal line, it indicates strengthening upward momentum; the opposite indicates strengthening downward momentum.
-
RSI Overbought/Oversold Filter: The RSI indicator (period 14) determines whether the market is overbought or oversold. The strategy only considers entry when RSI>50 (bullish market) or RSI<50 (bearish market).
-
TRAMA Trend Smoothing: The Triple Exponential Moving Average (period 14) effectively reduces price noise through triple smoothing, more clearly showing the primary trend direction.
-
ATR Volatility Channel: An ATR-based price channel (period 200, multiplier 6.0) determines market volatility range and establishes dynamic support and resistance levels.
Entry conditions strictly require multiple indicator confluence:
- Buy Condition: MACD line crosses above signal line + RSI>50 + price above both EMA9 and EMA21
- Sell Condition: MACD line crosses below signal line + RSI<50 + price below both EMA9 and EMA21
Strategy Advantages
-
Multi-indicator Confirmation: By requiring multiple technical indicators to confirm simultaneously, the strategy significantly reduces the possibility of false signals, improving trading reliability.
-
Complete Trend Cycle Capture: The combination of short, medium, and long-term moving averages allows the strategy to adapt to market fluctuations across different timeframes, capturing both short-term swings and long-term trends.
-
Dynamic Risk Management Framework: The ATR volatility channel automatically adjusts based on actual market volatility, providing dynamic support and resistance levels for more flexible risk control.
-
Noise Filtering Capability: TRAMA significantly reduces price noise through triple smoothing, making trading decisions more objective and rational.
-
Comprehensive Market State Assessment: The strategy integrates trend indicators (EMA system), momentum indicators (MACD), and volatility indicators (RSI), providing a comprehensive assessment of market conditions.
Strategy Risks
-
Delayed Trend Reversal Identification: Due to the use of multiple moving averages for confirmation, the strategy may experience lag in the early stages of trend reversals, leading to partial profit retracement. The solution is to adjust short-term EMA parameters (such as EMA9) to increase sensitivity, or add volatility-based stop-loss mechanisms.
-
Poor Performance in Range-bound Markets: In sideways or trendless market environments, the strategy may generate frequent false signals. This can be addressed by adding trend strength indicators like ADX, or pausing trading when the market is identified as being in a consolidation phase.
-
Parameter Optimization Dependency: The strategy's multiple parameters (such as various indicator periods) need to be optimized for different markets and timeframes; inappropriate parameters can severely impact performance. Historical backtesting and cross-validation methods are recommended for robust parameter optimization.
-
Black Swan Event Vulnerability: Technical indicators based on historical data may completely fail in the face of black swan events with dramatic market changes. It is advisable to add dynamic ATR-based stop-losses and maximum loss limits as risk control mechanisms.
-
Multi-indicator Redundancy Risk: Using too many technical indicators may lead to information redundancy and overfitting. The contribution of each indicator should be periodically evaluated, redundant indicators eliminated, and the strategy kept concise and efficient.
Strategy Optimization Directions
-
Add Trend Strength Filtering: It is recommended to incorporate the Average Directional Index (ADX) as a trend strength filter, executing trades only in strong trend market environments (e.g., ADX>25) to avoid false signals in weak trend or oscillating markets.
-
Improve Stop-Loss and Take-Profit Mechanisms: The current strategy lacks explicit stop-loss and take-profit mechanisms. Adding ATR-based trailing stops and take-profit levels based on support/resistance or risk-reward ratios would improve capital management efficiency.
-
Add Volume Confirmation: Price movements should be accompanied by corresponding volume changes to be more credible. Adding volume indicators (such as OBV or CMF) as additional confirmation would filter price fluctuations in low-volume environments.
-
Volatility-Adaptive Parameters: Optimal parameters may vary significantly across different market environments. Designing a volatility-adaptive algorithm based on ATR could allow indicator parameters (such as MACD or RSI periods) to dynamically adjust according to market volatility conditions.
-
Integrate Machine Learning Optimization: Machine learning algorithms (such as random forests or neural networks) could be used to optimize the weight distribution of multiple indicators or develop more intelligent entry timing selection algorithms, improving the strategy's adaptability.
Conclusion
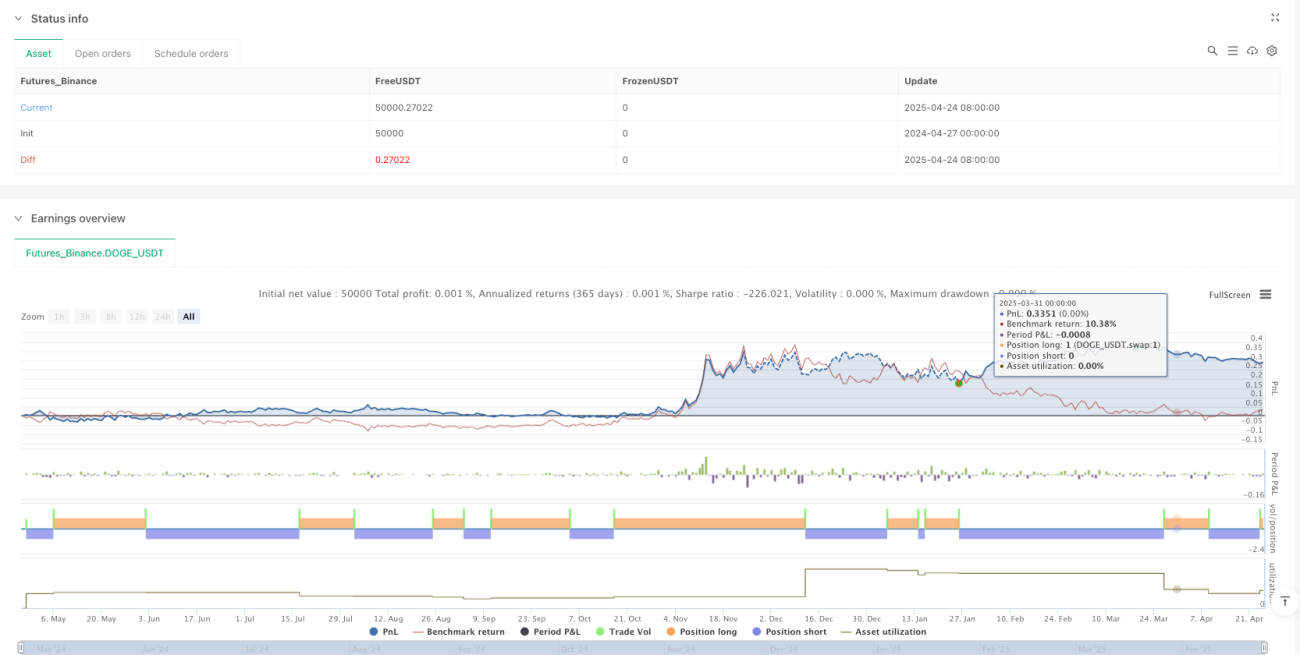
The Multi-Moving Average and Technical Indicator Trend Following Trading Strategy is a comprehensive and robust trading system that effectively identifies market trends and executes trades through collaborative analysis of multiple indicators including EMA, RSI, MACD, TRAMA, and ATR. The strategy's greatest strength lies in its multi-layered signal confirmation mechanism, significantly reducing false signal risk; its main challenges are delayed identification at trend turning points and dependency on market conditions.
By adding trend strength filtering, improving stop-loss and take-profit mechanisms, incorporating volume confirmation, implementing volatility-adaptive parameters, and integrating machine learning optimization, this strategy has the potential to further enhance its stability and profitability across different market environments. Ultimately, successful application of this strategy still requires the trader's deep understanding of the market and continuous monitoring and adjustment of the trading system.
- 1