
Overview
The QQE Sharpe Maximization Intelligent Trading System V2 is a strategy that leverages the QQE Mod indicator to detect momentum shifts, combined with a trend filter based on EMA and Heikin Ashi, as well as a volume filter that requires volume to be above its moving average to validate entry signals. The strategy operates bidirectionally (long and short) with automatic reversals and manages risk through dynamic trailing stops based on ATR, allowing it to maximize profits during strong trends while avoiding trading in low-interest market zones.
Strategy Principles
The core of this strategy is the QQE Mod indicator, which is a variant of the RSI (Relative Strength Index) that identifies potential trend changes and reversal points by tracking the relationship between RSI and its own moving average. Signals are generated when RSI crosses a dynamically adjusted threshold line (trailingLine).
Specifically, the strategy executes the following steps:
- Calculates RSI values and applies Wilders smoothing to form a more stable RSI curve.
- Computes the absolute value of RSI changes (delta) and averages it using the Wilders method.
- Establishes a dynamic threshold line based on the average delta value and a user-defined threshold factor (thresh).
- Generates long signals (1) when RSI is above the dynamic threshold line and short signals (-1) when below.
- Confirms trends using EMA and Heikin Ashi calculated average closing prices.
- Bullish trend: price above EMA and Heikin Ashi close above EMA
- Bearish trend: price below EMA
- Checks that volume is above its SMA (Simple Moving Average) to ensure adequate market participation.
- Calculates dynamic trailing stop positions based on ATR, setting different stop points for long and short positions.
- Automatically closes existing positions and opens new ones when entry conditions for the opposite direction are met.
Strategy Advantages
-
Multiple Confirmation Mechanism: By combining QQE signals, trend filtering, and volume confirmation, the strategy significantly reduces false signals and improves trade quality.
-
Adaptability: The dynamic threshold line automatically adjusts according to market volatility, enabling the strategy to adapt to different market conditions.
-
Risk Management: ATR-based dynamic trailing stops ensure that potential losses are limited while preserving most profits, particularly suitable for capturing continuation trends.
-
Automatic Reversals: The strategy can automatically close positions and open in the opposite direction without manual intervention, reducing emotional decision-making.
-
Volume Validation: By requiring volume above its average level, the strategy avoids trading in environments with insufficient liquidity, improving execution quality.
-
Technical Indicator Synergy: The combination of QQE, EMA, Heikin Ashi, and volume indicators provides a comprehensive market perspective, capturing multiple dimensions including price, trend, and market participation.
Strategy Risks
-
False Breakout Risk: Despite multiple filters, false breakouts may still occur in highly volatile environments, leading to unnecessary trades. Solution: Consider adding volatility filters or increasing volume requirements.
-
Over-optimization Risk: The multiple parameters in the strategy (such as RSI length, EMA length, ATR multiplier, etc.) risk overfitting historical data. Solution: Robustness testing should be conducted across different timeframes and market conditions.
-
Trend Change Lag: EMA-based trend filtering may respond slowly during the initial phases of trend changes. Solution: Consider using more sensitive trend indicators or incorporating shorter-period moving averages.
-
Trailing Stop Adjustment: Fixed ATR multipliers may perform inconsistently in different volatility environments. Solution: Implement adaptive ATR multipliers that dynamically adjust based on market volatility.
-
Transaction Cost Impact: Frequent reversal trades may result in high transaction costs. Solution: Add minimum holding time requirements or increase signal confirmation thresholds.
Strategy Optimization Directions
-
Add Time Filters: Implement trading session filtering to avoid trading during highly volatile periods around market opens or closes and during low liquidity periods. This can reduce poor trades caused by poor liquidity or abnormal price volatility.
-
Intelligent Parameter Optimization: Develop adaptive parameter adjustment mechanisms that allow RSI length, threshold, and ATR multipliers to automatically adjust based on market conditions. This can enhance the strategy's adaptability and robustness across different market environments.
-
Multi-timeframe Analysis: Integrate higher timeframe trend confirmation to reduce counter-trend trading. By ensuring trade direction aligns with larger market trends, the strategy's success rate can be improved.
-
Improved Stop-Loss Strategy: Implement volatility-based dynamic stop-loss adjustments, tightening stops in low-volatility environments and widening them in high-volatility environments. This better balances risk and reward.
-
Add Profit Targets: In addition to trailing stops, incorporate partial profit-taking mechanisms based on support/resistance levels or price targets. This allows locking in partial profits when price reaches key levels rather than waiting for trailing stops to trigger.
-
Integrate Machine Learning: Apply machine learning algorithms to predict the effectiveness of QQE signals and dynamically adjust strategy weights based on historical performance. Learning market patterns can further enhance the strategy's predictive capabilities.
Summary
The QQE Sharpe Maximization Intelligent Trading System V2 is a comprehensive trading strategy that cleverly combines momentum detection (QQE Mod), trend confirmation (EMA and Heikin Ashi), and volume validation to form a multi-layered trading decision system. Its core strengths lie in its automatic reversal functionality and ATR-based dynamic trailing stops, allowing it to adapt to changing market conditions and effectively manage risk.
The strategy is particularly suited for medium to long-term trend trading, performing best in markets with clear direction and sufficient volume. While some inherent risks exist, such as false breakouts and parameter optimization challenges, these can be mitigated through the suggested optimization directions. By adding time filters, implementing intelligent parameter optimization, integrating multi-timeframe analysis, and improving stop-loss strategies, the system can further enhance its robustness and adaptability.
Overall, this is a well-designed quantitative trading strategy suitable for traders looking to capture medium to long-term trends in the market while effectively managing risk. With the implementation of the suggested optimizations, it has the potential to become an even more comprehensive and efficient trading system.
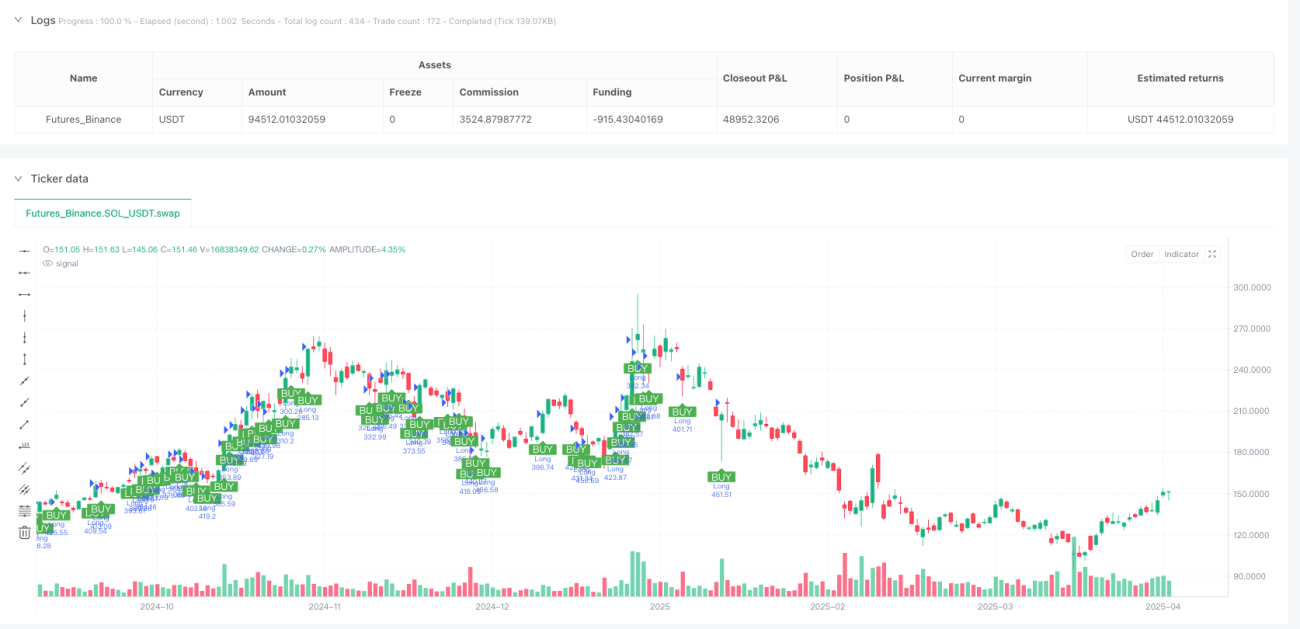
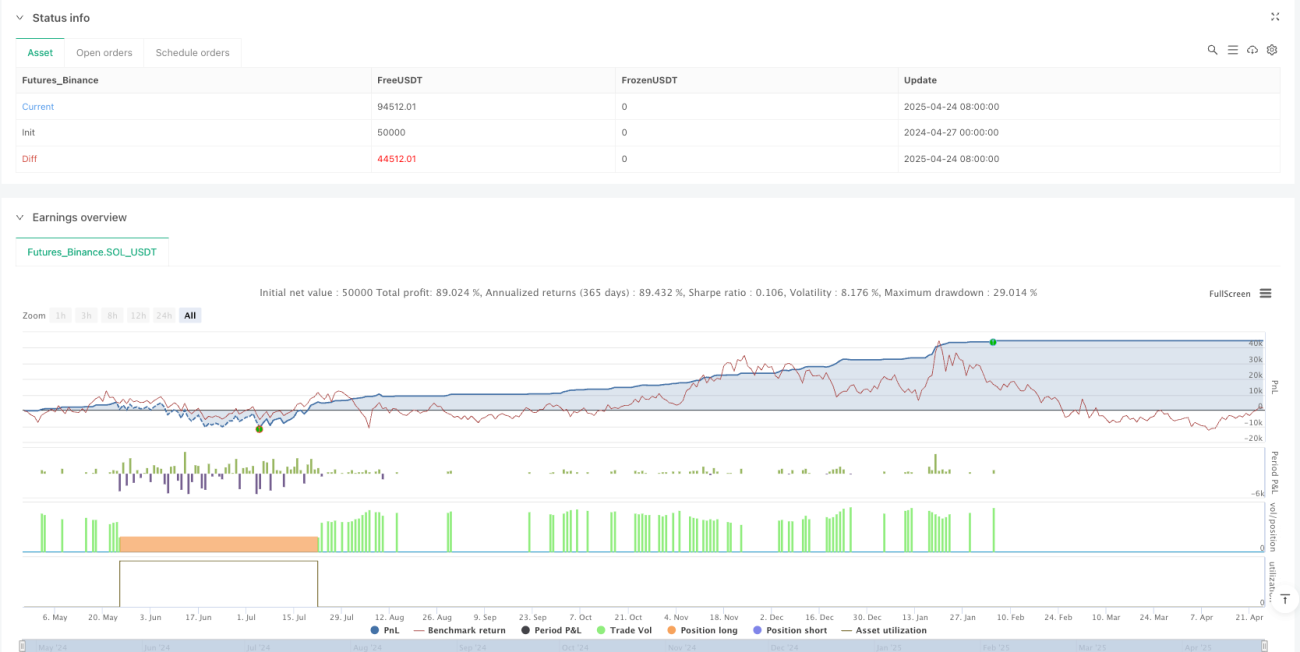
/*backtest
start: 2024-04-27 00:00:00
end: 2025-04-25 08:00:00
period: 1d
basePeriod: 1d
exchanges: [{"eid":"Futures_Binance","currency":"SOL_USDT"}]
*/

//@version=6
strategy("QQE SHARPE MAX BOT v2 - Reversals + Trailing + Volumen", overlay=true, default_qty_type=strategy.percent_of_equity, default_qty_value=100)

// === INPUTS ===- 1