Relative Strength Index Seasonal Long Optimization Strategy

Overview
The Relative Strength Index Seasonal Long Optimization Strategy is a quantitative trading approach based on technical indicators and seasonal analysis, specifically designed for markets with distinct seasonal performance patterns. This strategy uses Relative Strength Index (RSI) oversold signals and Exponential Moving Average (EMA) support levels as entry conditions, while incorporating historical seasonal data to filter the best trading months for improved win rates and overall returns. The core concept involves establishing long positions during historically advantageous months when the market is technically oversold yet maintaining an overall upward trend, with fixed percentage-based take-profit and stop-loss levels for risk control.
Strategy Principles
The strategy's core principles combine three key elements: technical indicator signals, seasonal analysis, and a risk management system.
First, the strategy employs a 14-period RSI as an oversold indicator, considering the market oversold when RSI drops below 30. It simultaneously uses a 200-period EMA as a trend confirmation tool, requiring price to remain above this long-term moving average to ensure trades are only executed during overall uptrends.
Second, the strategy incorporates a seasonal filtering mechanism based on 10-year historical data analysis, categorizing trading months into two types: "weaker" months with a 70% win ratio (April, May, June) and "strong" months with over 90% win ratio (July, November). The strategy only activates during these historically favorable months, determined by the allowedMonth variable.
A long signal is triggered when all the following conditions are met:
- RSI below 30 (oversold condition)
- Price above 200 EMA (uptrend confirmation)
- Current month is among the allowed seasonal months (April, May, June, July, or November)
For risk management, the strategy implements fixed percentage-based take-profit (5%) and stop-loss (2.5%) levels, creating a 1:2 risk-reward ratio, which is a relatively conservative and reasonable setup.
Strategy Advantages
-
Clear Seasonal Edge: The strategy effectively leverages market seasonality by trading only during months with the best historical performance, significantly improving the overall win rate. It distinguishes between "strong months" (marked in red, with win rates above 90%) and "weaker months" (marked in green, with approximately 70% win rates), further enhancing trader perception through visualized background colors.
-
Multiple Confirmation Mechanism: By combining RSI oversold signals with price positioning above the long-term EMA, the strategy ensures entries only occur when both technical and trend confirmations align, effectively filtering out false signals.
-
Flexible Testing Framework: The strategy includes a built-in RSI multi-parameter testing function (testRSI) that simultaneously tests different scenarios with RSI values of 25, 35, and 40, allowing strategy developers to optimize RSI parameters and find optimal settings.
-
Comprehensive Risk Management: The strategy sets clear take-profit and stop-loss percentages (5% take-profit, 2.5% stop-loss), creating a 1:2 risk-reward ratio that aligns with sound money management principles.
-
Intuitive Visual Feedback: The strategy marks buy signals on the chart and differentiates seasonal strength across different months through background colors, providing excellent visual guidance.
Strategy Risks
-
Seasonal Data Dependency Risk: The strategy heavily relies on seasonal data from the past 10 years, but market conditions may change, and historical seasonal patterns may not persist in the future. Regular updates to seasonal analysis are recommended to ensure data relevance.
-
Technical Indicator Lag: RSI and EMA technical indicators inherently have lag, which may prevent timely identification of turning points in rapidly changing markets. A potential solution is to incorporate more sensitive short-term indicators as supplementary confirmation.
-
Fixed Take-Profit/Stop-Loss Limitations: The strategy uses fixed percentage-based take-profit and stop-loss levels without accounting for market volatility changes. During high volatility periods, these fixed percentages may be too small; during low volatility periods, they may be excessive. Consider dynamic adjustments based on volatility indicators like ATR (Average True Range).
-
Parameter Optimization Overfitting Risk: While the RSI multi-parameter testing function is beneficial for optimization, excessive optimization may lead to overfitting, resulting in poor performance in live trading. Forward testing and out-of-sample testing are recommended to verify parameter robustness.
-
Single-Direction Strategy Limitations: The current strategy only focuses on long opportunities and may underperform in downtrends or sideways markets. Consider adding short strategies or market-neutral approaches to adapt to broader market conditions.
Strategy Optimization Directions
-
Dynamic RSI Threshold Adjustment: The strategy currently uses a fixed RSI threshold (30). Consider dynamically adjusting the RSI standard based on market volatility. For example, in higher volatility environments, the RSI threshold could be lowered to 25 or below; in lower volatility environments, it could be raised to 35 or higher. Implementation could be based on ATR or historical volatility indicators.
-
Refined Seasonal Analysis: The current strategy divides seasonality by month only. Consider further refinement to specific periods within months, such as early, mid, or late month, or incorporating weekly seasonal patterns for more precise seasonal advantages.
-
Add Trend Strength Filtering: Beyond the simple determination of price above the moving average, introduce trend strength indicators (such as ADX, MACD, or moving average slope) to ensure entries occur only during strong trends, further improving win rates.
-
Adaptive Take-Profit/Stop-Loss Mechanism: Convert fixed percentage-based take-profit and stop-loss levels to dynamic mechanisms based on market volatility, such as using ATR multiples for stop-loss placement and support/resistance levels for take-profit targets.
-
Enhanced Money Management: The current strategy uses a fixed 100% position size. Consider dynamically adjusting position size based on signal strength, market environment, or current drawdown status to achieve an optimized equity curve.
-
Add Trading Time Filters: For intraday strategies, consider adding time filters to avoid periods with high volatility or poor liquidity (such as around market open and close), reducing slippage and execution risk.
Conclusion
The Relative Strength Index Seasonal Long Optimization Strategy is a quantitative trading system combining technical analysis with seasonal research, capturing long opportunities in specific markets during historically strong months through a triple mechanism of RSI oversold signals, EMA trend confirmation, and monthly seasonal filtering. The strategy features a reasonable risk management framework and provides multi-parameter testing capabilities for optimization.
The strategy's main advantages lie in its clear seasonal filtering and multiple confirmation mechanisms, though it also has limitations including seasonal dependency risk and technical indicator lag. Future optimization directions include dynamic adjustment of technical indicator thresholds, refined seasonal analysis, and improved risk management systems.
For traders, this strategy provides a systematic trading framework combining historical statistical advantages with technical analysis, particularly suitable for medium to long-term investors focused on seasonal patterns. However, users should fully understand its limitations and make appropriate adjustments based on personal risk preferences and market conditions before implementation.
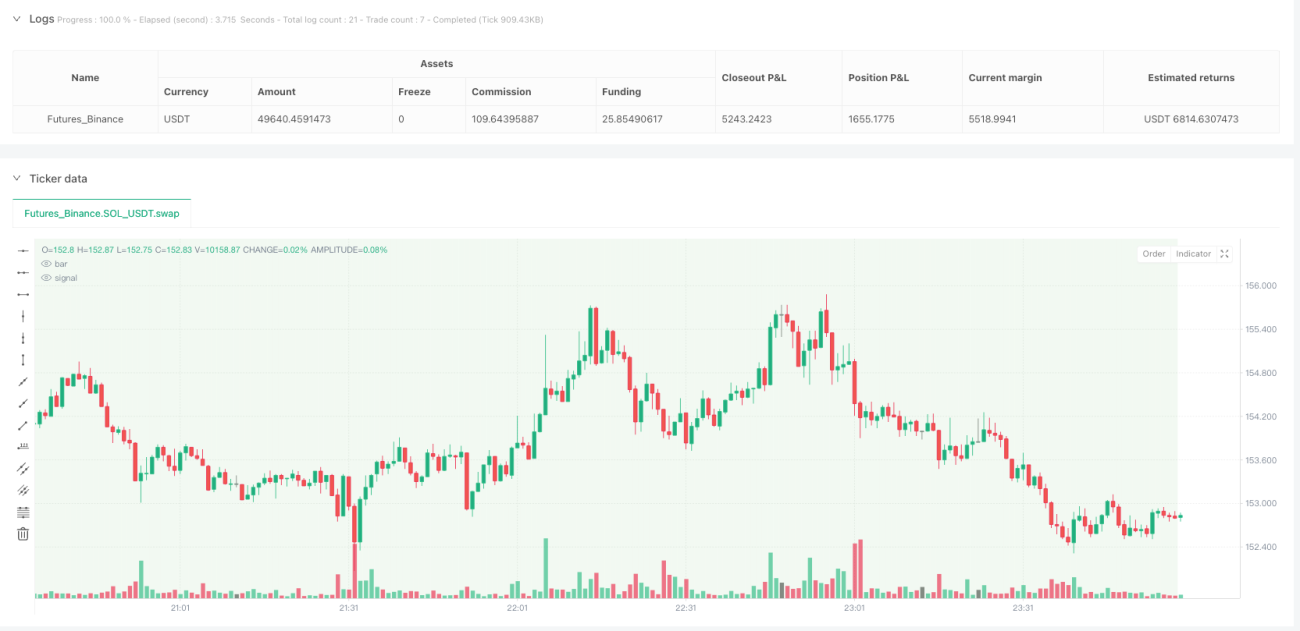
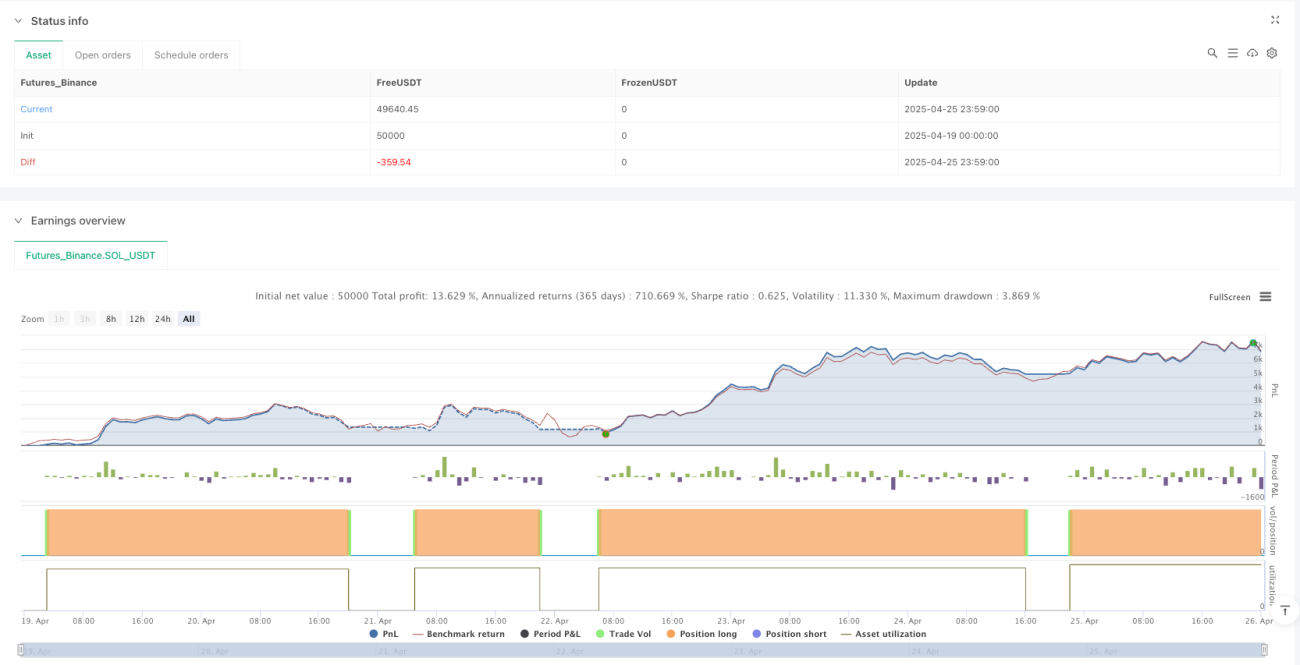
/*backtest
start: 2025-04-19 00:00:00
end: 2025-04-26 00:00:00
period: 1m
basePeriod: 1m
exchanges: [{"eid":"Futures_Binance","currency":"SOL_USDT"}]
*/

//@version=6
strategy('US30 RSI Seasonal Long Strategy (1D)', overlay = true, default_qty_type = strategy.percent_of_equity, default_qty_value = 100)

// === Monats-Filter: Nur in starken saisonalen Monaten ===- 1