
Overview
This strategy is a quantitative trading system that combines RSI-WMA crossover signals with EMA trend filtering, generating trade signals by identifying crossover points between RSI and its WMA, confirmed by EMA trend direction. The strategy features dynamic Stop Loss (SL) and Take Profit (TP) mechanisms, automatically calculating risk-reward ratios based on the golden ratio, providing a solid risk management framework. This system aims to capture overbought/oversold reversal signals with trend direction validation, improving trading success rates.
Strategy Principle
The strategy is built on two technical pillars: RSI-WMA crossover signals and EMA trend filtering.
First, the strategy calculates the standard Relative Strength Index (RSI) using 14 periods as the default setting. It then applies a 45-period Weighted Moving Average (WMA) to the RSI, creating a smoothed RSI indicator line. When RSI crosses above its WMA, a potential long signal is generated; when RSI crosses below its WMA, a potential short signal is generated.
Second, the strategy employs a 120-period Exponential Moving Average (EMA) as a trend filter. Long signals are only confirmed when price is above the EMA; short signals are only confirmed when price is below the EMA. This mechanism ensures trades align with the current market trend direction, avoiding counter-trend trading.
After signal confirmation, the strategy automatically sets dynamic stop loss and take profit levels:
- For long trades: Stop loss is set at the lower of the lows of the last two candles, and take profit is based on the entry price plus the distance between entry and stop loss multiplied by the risk-reward ratio (default 1.613, close to the golden ratio)
- For short trades: Stop loss is set at the higher of the highs of the last two candles, with take profit calculated similarly but in the opposite direction
This dynamic risk management approach allows the strategy to adapt to changes in market volatility rather than using fixed stop loss points.
Strategy Advantages
-
Dual Confirmation Mechanism: Provides overbought/oversold signals through RSI-WMA crossovers while ensuring trade direction aligns with market trends using the EMA filter, reducing the probability of false signals.
-
Intelligent Dynamic Risk Management: Stop loss positions automatically adjust based on recent market volatility, rather than static fixed points, better handling different market environments.
-
Optimized Risk-Reward Ratio: Default use of a 1.613 risk-reward ratio, close to the golden ratio, balances risk control and profit maximization.
-
Simple Flexible Parameter Settings: The strategy includes only four key parameters (EMA length, RSI length, WMA length, and risk-reward ratio), making it easy to optimize and adjust.
-
Visual Indicator Integration: By plotting EMA, RSI, and WMA-RSI lines on the chart, traders can visually understand the strategy's decision-making process.
Strategy Risks
-
Trend Turning Point Lag: EMA as a trend filter has inherent lag, which may cause missed trading opportunities or false signals near trend reversal points.
-
Frequent Signals in Ranging Markets: In sideways markets, RSI and WMA-RSI may cross frequently, generating excessive trade signals and increasing transaction costs.
-
Stop Loss Setting Limitations: The stop loss strategy based on the last two candles may set overly wide stops in extremely volatile markets, leading to excessive per-trade risk; or set overly tight stops in low-volatility environments, easily triggered by market noise.
-
Parameter Sensitivity: Key parameters such as EMA length and WMA length significantly impact strategy performance, and different market environments may require different parameter settings.
-
Lack of Volume Confirmation: The strategy relies solely on price-derived indicators without integrating volume information for additional confirmation, potentially affecting signal quality.
Solutions include comprehensive parameter optimization testing, introducing adaptive parameter mechanisms, adding volume filters, and implementing stricter trade frequency control rules.
Strategy Optimization Directions
-
Implement Adaptive Parameters: RSI and WMA lengths could dynamically adjust based on market volatility, allowing the strategy to better adapt to different market conditions. For example, shorter RSI periods in high-volatility markets and longer RSI periods in low-volatility markets.
-
Add Volume Confirmation: Integrate volume indicators as additional signal confirmation conditions to improve signal quality. For example, only confirm signals when trading volume is rising or require volume above its moving average.
-
Optimize Trend Filter: Consider using dual EMA crossovers or incorporating the ADX indicator to more precisely identify trend strength, reducing the lag issues with the EMA trend filter.
-
Refine Risk Management Mechanism: Base stop loss levels on ATR (Average True Range) rather than simply using recent candle lows/highs, providing more precise risk control.
-
Add Time Filters: Introduce trading session filtering to avoid periods of low market volatility or high uncertainty, such as before and after major data releases.
-
Enhance Signal Quality Filtering: Filter for higher quality signals by requiring the crossover angle between RSI and WMA-RSI to reach a minimum threshold, or requiring crossovers to occur near key RSI levels (such as 30/70).
These optimization directions aim to improve the strategy's robustness and adaptability, enhancing its performance across various market environments while maintaining the core logic simplicity.
Summary
The RSI-WMA Dynamic Crossover Trend Following Strategy is a quantitative trading method combining the RSI-WMA signal system with EMA trend filtering, providing reasonable risk management through dynamic stop loss and take profit mechanisms. The strategy's core strengths lie in its dual confirmation mechanism and intelligent dynamic risk management, though it also faces challenges such as trend reversal point lag and parameter sensitivity.
By introducing adaptive parameters, volume confirmation, optimizing the trend filter, and refining risk management, this strategy has the potential to become a more robust trading system. It is particularly effective in clearly trending markets, where it can efficiently capture RSI reversal signals while using EMA trend filtering to avoid counter-trend trading.
This strategy is especially suitable for medium to long-term traders, particularly those who prioritize risk management and wish to trade in alignment with major market trends. Through proper parameter setting and appropriate risk management strategies, traders can use this system to seek stable returns across various market environments.
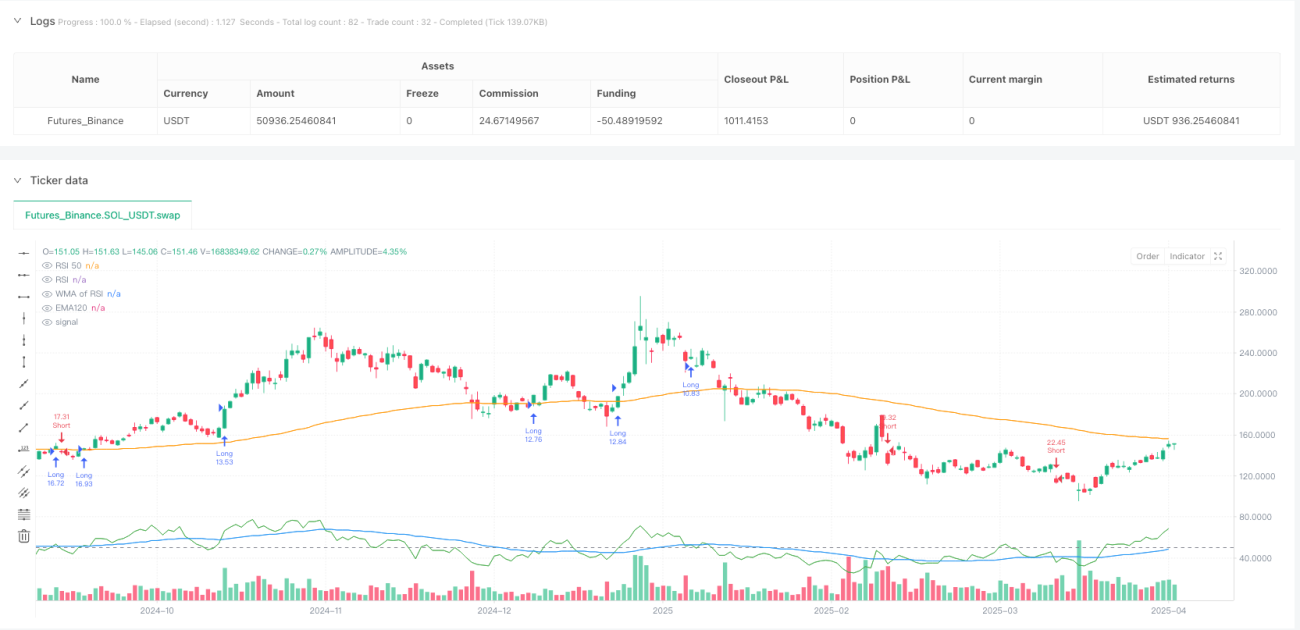
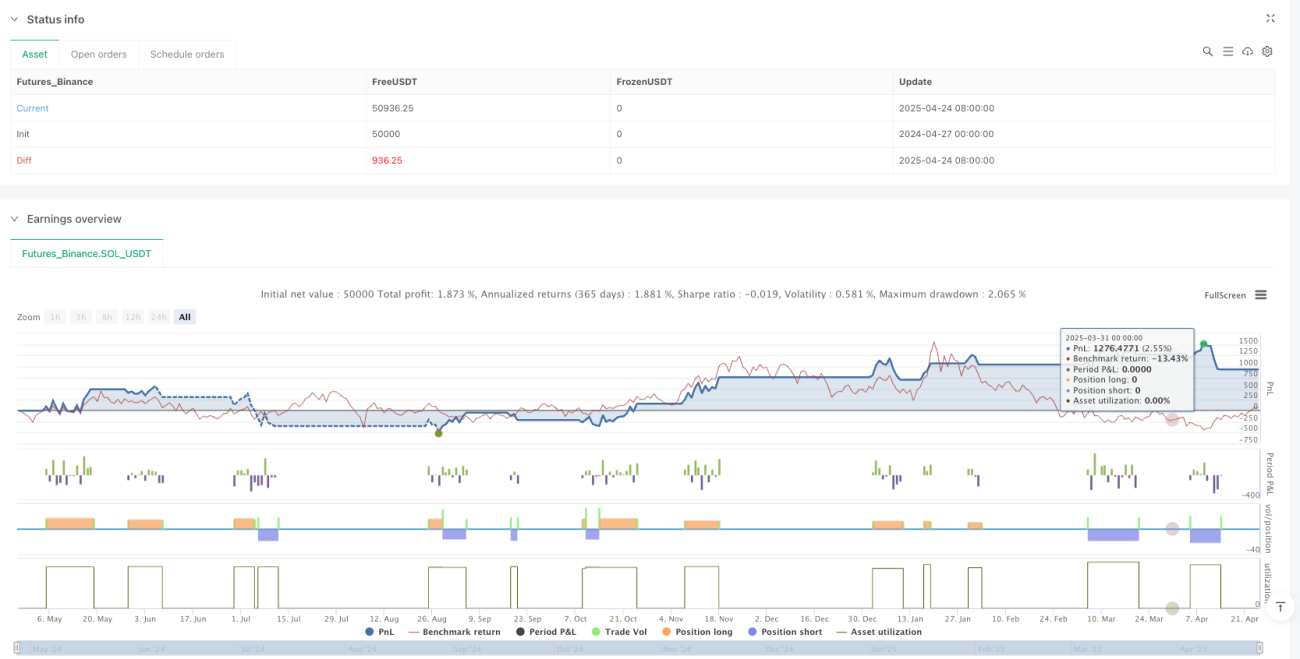
/*backtest
start: 2024-04-27 00:00:00
end: 2025-04-25 08:00:00
period: 1d
basePeriod: 1d
exchanges: [{"eid":"Futures_Binance","currency":"SOL_USDT"}]
*/

//@version=5
strategy("RSI-WMA + EMA Trend Filter | SL/TP Dynamic", overlay=true,
     default_qty_type=strategy.percent_of_equity, default_qty_value=5)
- 1