
Overview
The RSI-BB Multi-Indicator Crossover Momentum Strategy with Optimized Take Profit and Stop Loss System is a quantitative trading strategy based on multiple technical indicators, primarily utilizing EMA crossovers, RSI overbought/oversold regions, Bollinger Band breakouts, and CCI and volume confirmation to identify long entry opportunities. The core feature of this strategy is its combination of a fixed 5% take profit and 2% stop loss mechanism, operating on a 15-minute timeframe, designed to capture short-term market momentum while strictly controlling risk. The strategy confirms trading signals through multiple indicator resonance to improve trade quality, while using preset profit targets and risk control measures to automatically manage the trading cycle.
Strategy Principles
The trading logic of this strategy is built on comprehensive analysis of multiple technical indicators, with core entry conditions including five key elements:
- EMA Crossover Confirmation - When the 9-period EMA crosses above the 21-period EMA, indicating strengthened short-term momentum and forming a preliminary long signal.
- CCI Indicator Confirmation - The strategy requires the CCI value to be greater than 100, meaning the current price is in an overbought region relative to its average price, but still has upward momentum.
- RSI Momentum Confirmation - Requires the RSI indicator value to be greater than 50, verifying that the market is in an uptrend zone.
- Bollinger Band Breakout Confirmation - Price must break above the upper band, indicating significant momentum in the current uptrend.
- Volume Confirmation - Current volume must exceed the 15-period volume moving average, ensuring sufficient market liquidity to support price movements.
When all these conditions are met simultaneously, the strategy enters a long position. Once a position is established, the system automatically sets two exit conditions:
- Take profit point: 105% of the entry price (5% profit)
- Stop loss point: 98% of the entry price (2% loss)
This design creates a risk-reward ratio of 1:2.5, meaning that for every 1 unit of risk taken, the strategy expects to gain 2.5 units of return.
Strategy Advantages
- Multiple Confirmation Mechanism - Verification of trading signals through resonance of five independent indicators significantly reduces the risk of false signals and improves trade quality.
- Clear Risk Management - Built-in fixed-proportion take profit and stop loss mechanisms provide clear risk control parameters for each trade, avoiding emotional decision-making.
- Optimized Risk-Reward Ratio - The 5% profit target compared to a 2% stop loss creates a favorable 2.5:1 risk-reward ratio, contributing to long-term capital growth.
- Trend and Momentum Combination - Considers both trend direction (EMA crossover) and price momentum (RSI, CCI), avoiding entries in weak markets.
- Liquidity Screening - Through volume confirmation, ensures trading only when there is sufficient market participation, reducing slippage risk.
- Automated Trade Execution - Clear and programmable strategy rules reduce human intervention and emotional impact, improving execution consistency.
- Adaptation to Short-Term Fluctuations - The 15-minute timeframe design allows the strategy to respond quickly to market changes, suitable for intraday traders.
Strategy Risks
- Multiple Conditions Limiting Trading Frequency - Situations where five conditions are met simultaneously are relatively rare, potentially leading to scarce trading signals and missed opportunities.
- Bollinger Band Breakout Retracement Risk - Prices often retrace after breaking the upper band, potentially triggering stop losses, especially in highly volatile markets.
- Fixed Take Profit and Stop Loss Limitations - The fixed 5% and 2% proportions do not account for the volatility characteristics of different markets and periods; in low-volatility markets, the take profit may be too distant, while in high-volatility markets, the stop loss may be too close.
- Lack of Trend Filtering - Despite having EMA crossovers, there is no longer-period trend filtering mechanism, which may result in frequent long positions and losses during major downtrends.
- Dependency on Technical Indicator Lag - All technical indicators have some degree of lag, which may cause signal delays in rapidly changing markets.
- Only Considers Long Strategy - The current strategy only includes long signals, unable to capture downward opportunities in bearish markets, limiting the strategy's comprehensiveness.
Solutions:
- Add longer period trend filters, such as daily level trend confirmation
- Dynamically adjust take profit and stop loss ratios based on different market volatility
- Add short strategy components for bidirectional trading
- Incorporate more systemic risk control parameters, such as maximum daily trades, maximum risk exposure, etc.
Strategy Optimization Directions
- Dynamic Take Profit and Stop Loss Adjustment - Stop profit and loss levels can be dynamically set based on volatility indicators (such as ATR) rather than using fixed percentages, better adapting to market conditions.
- Add Trend Filters - Add longer period (such as 1-hour or 4-hour) trend filtering conditions, only opening positions when aligned with the major trend direction, improving win rates.
- Optimize Entry Timing - Wait for slight retracements after all conditions are met before entering, rather than entering immediately, to obtain better entry prices.
- Add Short Strategy - Develop corresponding short strategy conditions, enabling the strategy to profit in falling markets and improving capital utilization.
- Implement Trailing Stop Loss - Automatically adjust stop loss positions to breakeven or small profit after prices move a certain percentage in a favorable direction, protecting existing profits.
- Indicator Parameter Optimization - Conduct backtesting optimization on the period parameters of RSI, CCI, EMA, and Bollinger Bands to find the optimal parameter combinations for specific markets.
- Capital Management Optimization - The current strategy uses 100% of capital for entry; this can be optimized to dynamic position allocation based on account volatility or profit-loss ratio.
- Add Trading Session Filters - Avoid trading during sessions when volume is typically low or volatility is abnormal (such as before market open and close).
Implementing these optimization directions will help improve the strategy's robustness, adaptability, and long-term profitability, allowing it to maintain competitiveness in different market environments.
Conclusion
The RSI-BB Multi-Indicator Crossover Momentum Strategy with Optimized Take Profit and Stop Loss System is a comprehensive quantitative trading framework that screens for high-quality long entry points through multiple conditions including EMA crossovers, RSI momentum, CCI confirmation, Bollinger Band breakouts, and volume verification, while using preset take profit and stop loss mechanisms to manage trading risk. The strategy's greatest advantage lies in its strict multiple signal confirmation mechanism and clear risk management parameters, making trading decisions more objective and systematic.
However, the strategy also has some limitations, such as low signal frequency, fixed take profit and stop loss ratios, and support for long trades only. Through implementing dynamic risk control, adding trend filtering, optimizing indicator parameters, and incorporating short strategies and other optimization measures, this strategy has the potential to achieve more stable and sustainable trading performance across different market environments.
For quantitative traders, this strategy provides a practical framework balancing signal quality and risk control, particularly suitable for those focused on short-term price momentum who wish to limit the risk of each trade through clear rules. In practical application, it is recommended to first conduct thorough backtesting on historical data and adjust parameters in combination with specific market characteristics to achieve optimal trading results.
/*backtest
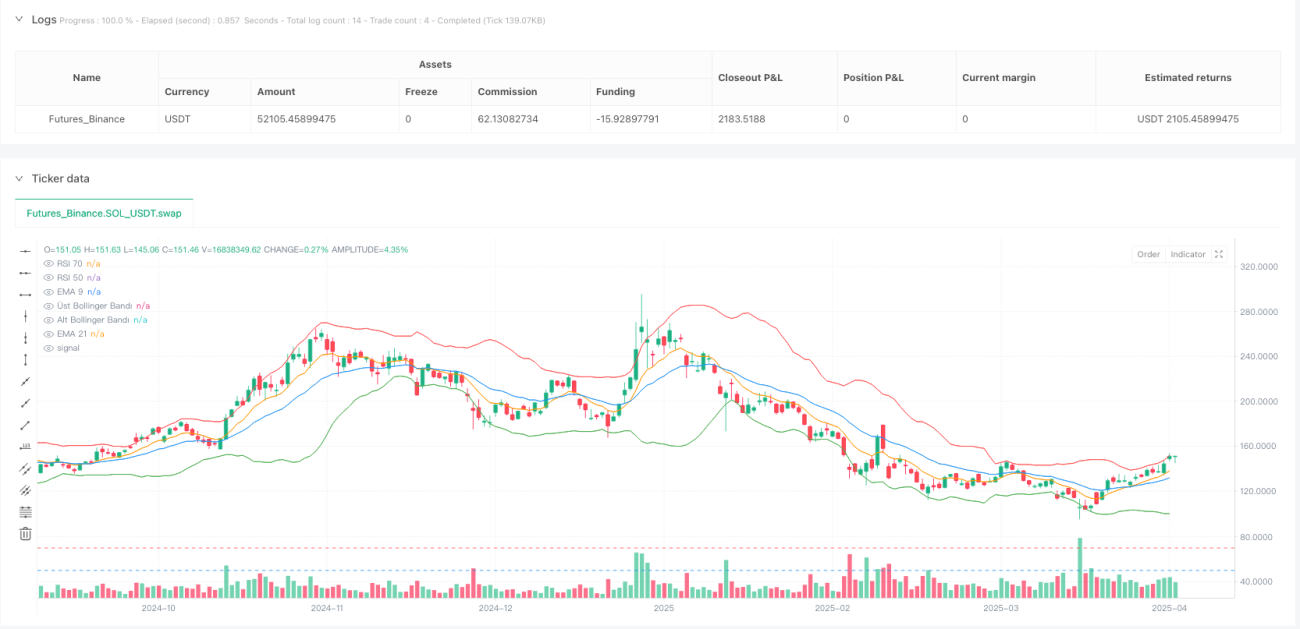
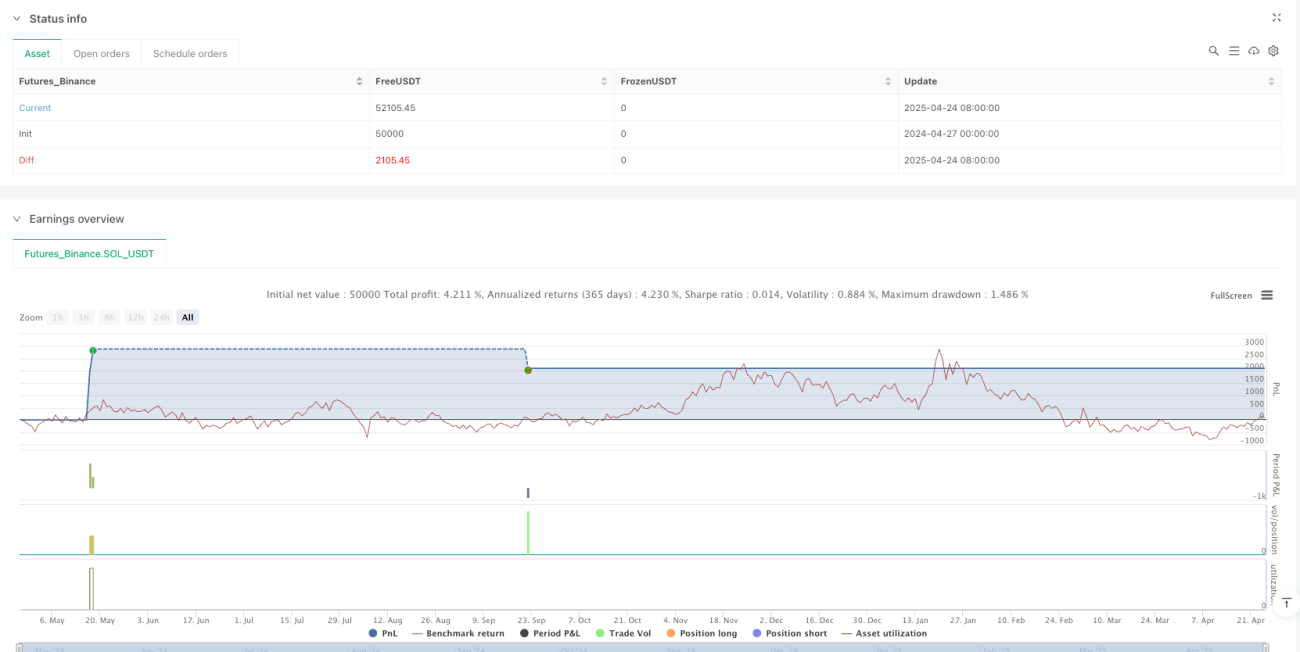
start: 2024-04-27 00:00:00
end: 2025-04-25 08:00:00
period: 1d
basePeriod: 1d
exchanges: [{"eid":"Futures_Binance","currency":"SOL_USDT"}]
*/
//@version=5
strategy("Yüzde 5 Kar ve Yüzde 2 Zarar Stop Stratejisi", overlay=true, default_qty_type=strategy.percent_of_equity, default_qty_value=100)
// Göstergeler- 1