
Overview
The RSI Overbought/Oversold Zone Momentum Breakout Quantitative Strategy is a trading system based on the Relative Strength Index (RSI) that focuses on capturing market momentum changes and price breakouts. The core of this strategy is identifying overbought and oversold areas through an adjusted RSI indicator, combined with EMA and SMA filters to enhance signal quality, and implementing strict time window and daily trade limits to control risk. This strategy employs clear take-profit targets and stop-loss mechanisms, suitable for intraday and short-term traders.
Strategy Principles
The core principle of this strategy is to capture RSI indicator breakouts from neutral zones into overbought or oversold areas, which typically signals potential price trend changes. The specific implementation is as follows:
-
Adjusted RSI Calculation: Standard 14-period RSI value minus 50, making the indicator fluctuate between -50 and +50, with the zero line as a neutral reference point.
-
Dynamic Threshold Setting: Sets different center values and fluctuation ranges based on market trends, automatically adjusting signal trigger thresholds in bullish and bearish market environments.
- Bullish center value: +5 (when price is above SMA200)
- Bearish center value: -5 (when price is below SMA200)
- Fluctuation range set to ±2
-
Signal Generation Logic:
- Long signal: When adjusted RSI breaks above the upper threshold (center value + fluctuation range) and price is above EMA (if enabled)
- Short signal: When adjusted RSI breaks below the lower threshold (center value - fluctuation range) and price is below EMA (if enabled)
-
Trade Management: The strategy only executes within specified trading hours (default 9:30 to 16:00 EST) and can set a maximum number of daily trades (default 5).
-
Risk Control: Uses fixed take-profit points (default 50 Ticks) and optional stop-loss points (default 30 Ticks) based on minimum price movement units (Ticks).
Strategy Advantages
-
Market Environment Adaptation: Divides bull and bear markets through SMA200, dynamically adjusts RSI threshold center points, enabling the strategy to adapt to different market environments.
-
Multiple Filtering Mechanisms: Combines EMA dynamic filtering and SMA200 trend filtering, significantly improving signal quality and reducing false breakouts.
-
Strict Time Management: Sets trading session windows, avoiding high volatility periods at market open and close, focusing on optimal market liquidity periods.
-
Risk Exposure Control: Prevents overtrading and overnight risk through daily trade limits and automatic close-at-session-end mechanisms.
-
Visual Feedback System: Provides intuitive market status and performance monitoring through color-coded price bars and a visual trading panel.
-
Flexible Parameter Configuration: All key parameters can be adjusted through input options, making the strategy adaptable to different trading instruments and timeframes.
Strategy Risks
-
False Breakout Risk: RSI breakouts may lead to false signals, especially in sideways markets. The solution is to add confirmation conditions, such as combining price patterns or volume confirmation.
-
Over-optimization Risk: Multiple parameter settings may lead to overfitting historical data. It is recommended to backtest under different market conditions to find robust parameter combinations.
-
Market Environment Dependency: The strategy may perform better in strong trending markets than in oscillating markets. The current market environment should be evaluated before use, adjusting parameters or pausing trading when necessary.
-
Fixed Take-Profit/Stop-Loss Limitations: Tick-based fixed take-profit and stop-loss points may not be suitable for all market conditions. Consider using volatility-based dynamic take-profit/stop-loss points, such as ATR multiples.
-
Time Window Limitations: Strict trading time windows may miss quality trading opportunities outside the session. Consider setting different trading windows for different markets.
Strategy Optimization Directions
-
Dynamic Threshold Optimization: The current strategy uses a fixed fluctuation range (±2); consider dynamically adjusting this range based on market volatility (such as ATR) to adapt to different market conditions.
-
Volatility Filter: Add volatility filtering conditions based on ATR, avoiding trading when volatility is too low, helping to reduce false signals in sideways markets.
-
Multi-Timeframe Confirmation: Integrate RSI signal confirmation across multiple timeframes, generating trading signals only when RSI directions are consistent across timeframes, improving signal quality.
-
Volume Confirmation Mechanism: Add volume conditions, requiring price breakouts to be accompanied by increased volume, enhancing signal reliability.
-
Profit Locking Mechanism: Implement dynamic trailing stops, automatically adjusting stop-loss positions as price moves favorably, locking in partial profits.
-
Entry Optimization: Add market structure conditions (such as support/resistance levels), entering only when key price levels break, improving win rates.
-
Adaptive Parameters: Implement mechanisms to automatically adjust RSI length and EMA periods based on market conditions, making the strategy more adaptive.
Summary
The RSI Overbought/Oversold Zone Momentum Breakout Quantitative Strategy is a well-structured trading system that provides traders with an effective tool for capturing market momentum shifts by combining RSI momentum breakouts, trend filtering, and strict risk management. The uniqueness of this strategy lies in its dynamic threshold adjustment mechanism, which automatically adjusts signal generation standards based on overall market trends.
The strategy's multiple filtering mechanisms and strict trading rules effectively reduce false signals, while flexible parameter configuration allows it to adapt to different trading instruments and market conditions. However, users should recognize the inherent limitations of RSI breakout strategies, especially their performance in sideways markets.
Through the suggested optimization directions, such as dynamic threshold adjustment, multi-timeframe confirmation, and volatility filtering, the robustness and adaptability of this strategy can be further enhanced. Overall, this is a strategy framework that balances signal quality and risk control, suitable for medium to short-term traders in intraday operations.
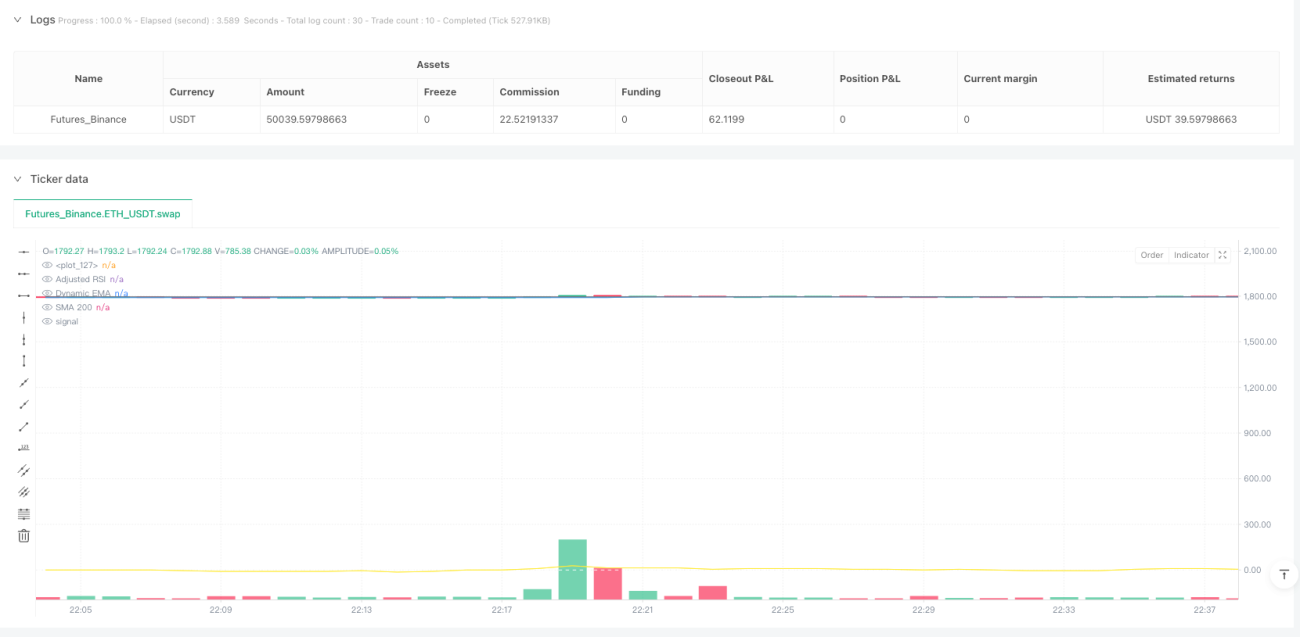
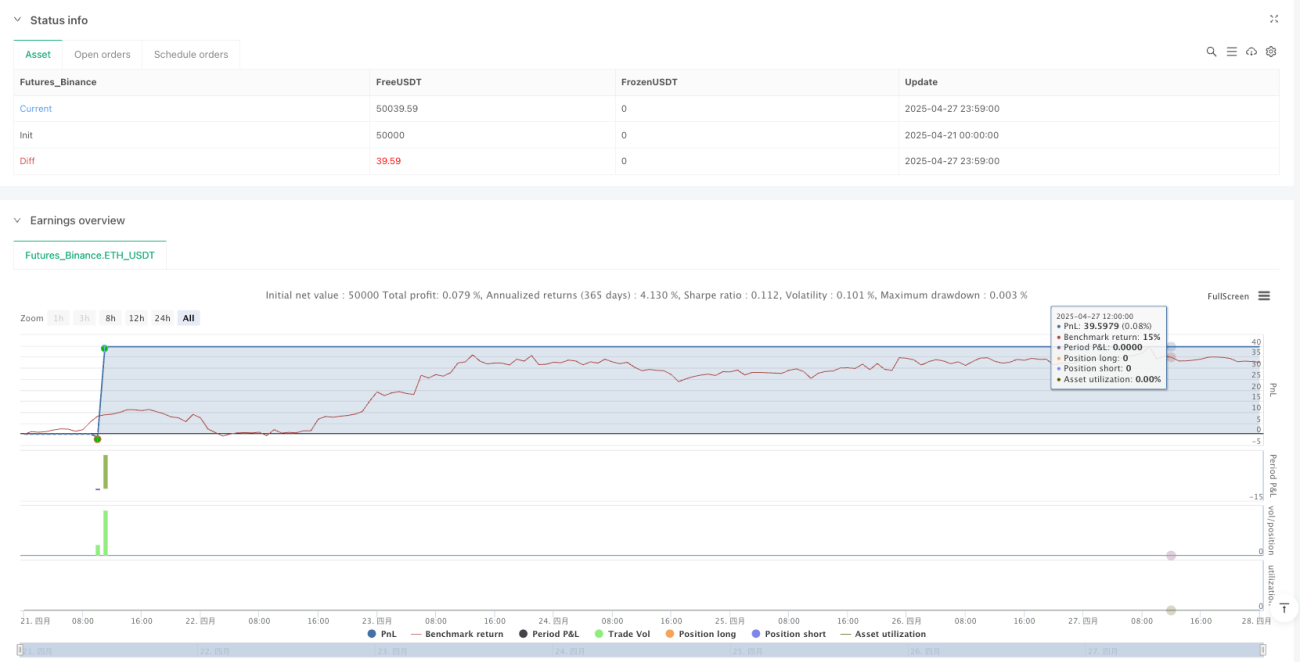
/*backtest
start: 2025-04-21 00:00:00
end: 2025-04-28 00:00:00
period: 1m
basePeriod: 1m
exchanges: [{"eid":"Futures_Binance","currency":"ETH_USDT"}]
*/

//@version=6
strategy('RSI SR OB Breakouts Strategy PRO (coffeshopcrypto)', overlay=true, default_qty_type=strategy.percent_of_equity, default_qty_value=15, max_bars_back=200, max_boxes_count=200, precision=2)

// === Inputs ===- 1