
Overview
The Multiple EMA Trend Confirmation Trading System is a quantitative trading strategy based on a combination of Exponential Moving Averages (EMAs), utilizing multi-timeframe analysis to confirm trend direction and trading signals. The core of this strategy relies on the EMA150 on the H4 timeframe as the primary trend determinant, combined with the relative positions of shorter-term moving averages (EMA36, EMA54, EMA89) and price-to-EMA interactions to generate trading signals. Additionally, the strategy integrates candlestick pattern recognition and volume analysis, implemented with a strict risk management system to achieve trading stability and profitability.
Strategy Principles
The operation of this strategy is based on several key components:
-
Trend Identification: Using the EMA150 on the H4 timeframe as the main trend direction indicator. When price is above EMA150, an uptrend is confirmed; when below, a downtrend is confirmed.
-
Multiple EMA System: The strategy employs four exponential moving averages (EMA36, EMA54, EMA89, and EMA150) to build the trading system. When shorter-term EMAs are positioned above longer-term EMAs (ema36 > ema54 > ema89 > ema150), an uptrend is confirmed; the reverse confirms a downtrend.
-
Price-EMA Interaction: The strategy looks for trading opportunities when price tests (retraces to) any of the EMA levels, indicating potential bounces from support or resistance.
-
Candlestick Pattern Confirmation:
- Bullish patterns: including bullish pinbars, engulfing patterns, inside bars, and morning stars
- Bearish patterns: including bearish pinbars, engulfing patterns, inside bars, and evening stars
-
Multi-Timeframe Exit Strategy: Uses the EMA150 on the M15 timeframe as an exit condition, closing positions when price breaks through this moving average, effectively locking in profits and reducing drawdowns.
-
Volume Confirmation: When trading volume suddenly increases to more than 2.5 times the 20-period average volume, the strategy considers this a signal of potential market reversal, triggering position closure.
-
Risk Management: The strategy employs dynamic stop-loss and take-profit settings based on ATR (Average True Range), with stop-loss distance set at 1.5 times ATR and a risk-reward ratio of 1:2.
Strategy Advantages
-
Integration of Multiple Confirmation Mechanisms: The strategy screens for high-probability trading opportunities through multi-layer confirmation (trend direction, EMA relationships, price action, candlestick patterns), effectively reducing the probability of false signals.
-
Multi-Timeframe Analysis: Integrating H4 timeframe for major trend determination and M15 timeframe for monitoring exit points enables a more comprehensive grasp of market dynamics, improving trading precision.
-
Dynamic Risk Management: ATR-based stop-loss settings automatically adjust according to market volatility, avoiding the problems of fixed stop-losses being either too large or too small, better adapting to different market environments.
-
Volume Confirmation: Monitoring abnormal trading volume as an additional exit signal can identify potential market reversals early, reducing drawdowns.
-
Visual Assistance: The strategy clearly marks trading signals, EMA positions, and current trend status on the chart, allowing traders to intuitively understand market conditions and strategy logic.
-
Real-time Win Rate Display: The strategy calculates and displays trading win rate and total trades in real-time, helping traders continuously evaluate strategy performance.
Strategy Risks
-
Poor Performance in Ranging Markets: In consolidating markets without clear trends, the EMA system may generate frequent false signals, leading to consecutive losses. It is recommended to pause trading with this strategy in ranging markets or raise entry standards.
-
Impact of Slippage and Trading Costs: The strategy accounts for a 0.04% commission, but in highly volatile markets or instruments with insufficient liquidity, slippage may significantly affect actual trading results. Sufficient capital buffer should be reserved to handle these costs.
-
Over-optimization Risk: The strategy uses multiple specific parameters (EMA periods, ATR multipliers, etc.), which may risk overfitting to historical data. Sufficient cross-period and cross-instrument backtesting is recommended before live trading.
-
Signal Delay Issues: EMAs are inherently lagging indicators and may not capture turning points in time during rapidly reversing markets. Consider adding momentum indicators as auxiliary judgment tools.
-
Candlestick Pattern Misinterpretation: The strategy relies on various candlestick patterns, some of which may have varying effectiveness under different market conditions. It is advisable to analyze the historical performance of each pattern on specific instruments in depth.
Strategy Optimization Directions
-
Adaptive Parameter Design: Consider changing the fixed EMA periods (36, 54, 89, 150) to dynamic parameters that automatically adjust based on market volatility for better adaptation to different market environments. This can be implemented by introducing volatility indicators (such as ATR ratio) for parameter self-adjustment.
-
Enhanced Market Environment Filtering: Introduce a market state classification mechanism, for example, using the ADX indicator to identify trend strength, suspending trading or adjusting strategy parameters in low-trend-strength environments to avoid frequent false signals in ranging markets.
-
Optimized Exit Mechanism: The existing strategy mainly relies on EMA150 crossovers on the M15 timeframe as exit points. Consider adding a trailing stop-loss mechanism for partial positions to capture more profit in strong trends. For example, implement phased exits, with one part exiting at fixed risk ratios and another using trailing stops to lock in profits.
-
Enhanced Volume Analysis: The current strategy only uses volume spikes as warning signals. Further refine volume analysis, for example, by analyzing volume accumulation and distribution patterns in conjunction with price action to identify more accurate market turning points.
-
Integration of Time Filters: Add screening for optimal trading sessions, avoiding low-liquidity or high-volatility periods (such as European-American market overlaps or major economic data release periods), which can significantly improve trading quality.
-
Machine Learning Enhancement: Consider introducing basic machine learning algorithms to score and filter existing trading signals, for example, through historical similar pattern matching to improve signal quality.
Conclusion
The Multiple EMA Trend Confirmation Trading System is a comprehensive trend-following strategy that builds a well-structured trading system through multi-timeframe analysis, multiple technical indicator confirmations, and strict risk management rules. The strategy's greatest advantage lies in its multi-layer confirmation mechanism, which effectively filters low-quality signals; its biggest challenge is the potential for false signals in ranging markets. Through the suggested optimization directions, especially adding market environment filtering and optimizing parameter adaptability, this strategy has the potential to further enhance stability and profitability across different market environments. For traders, understanding and mastering this system not only provides a specific trading strategy but, more importantly, cultivates systematic thinking and risk management awareness, which are the foundations of successful trading.
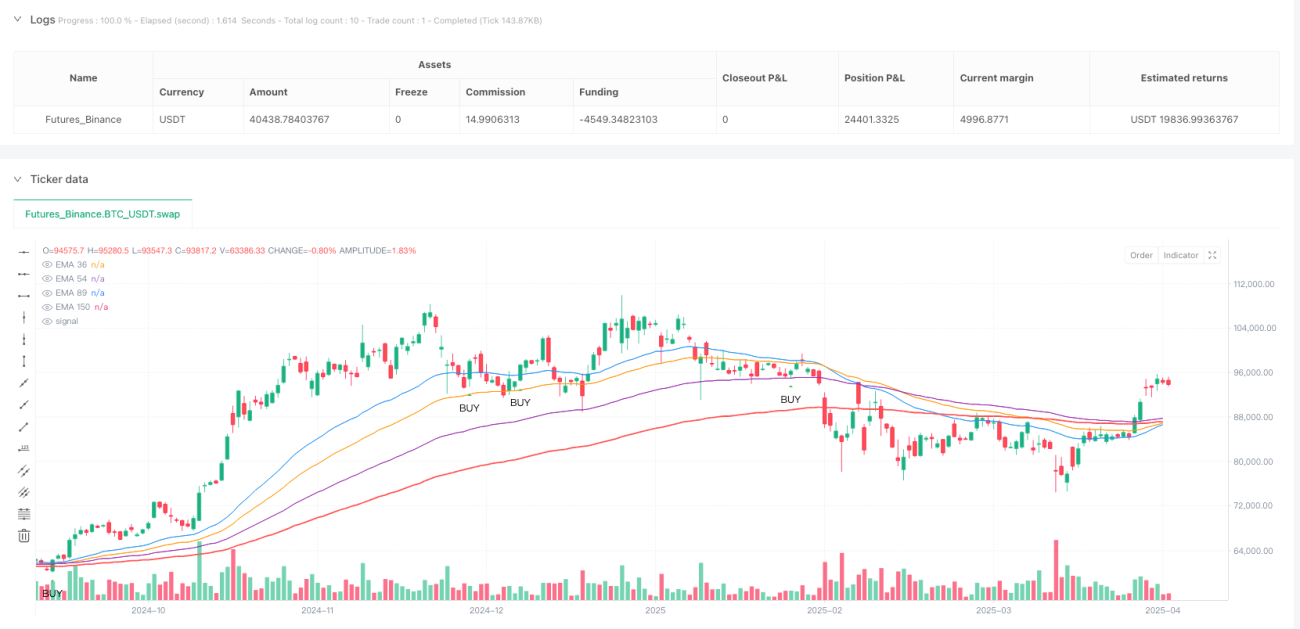
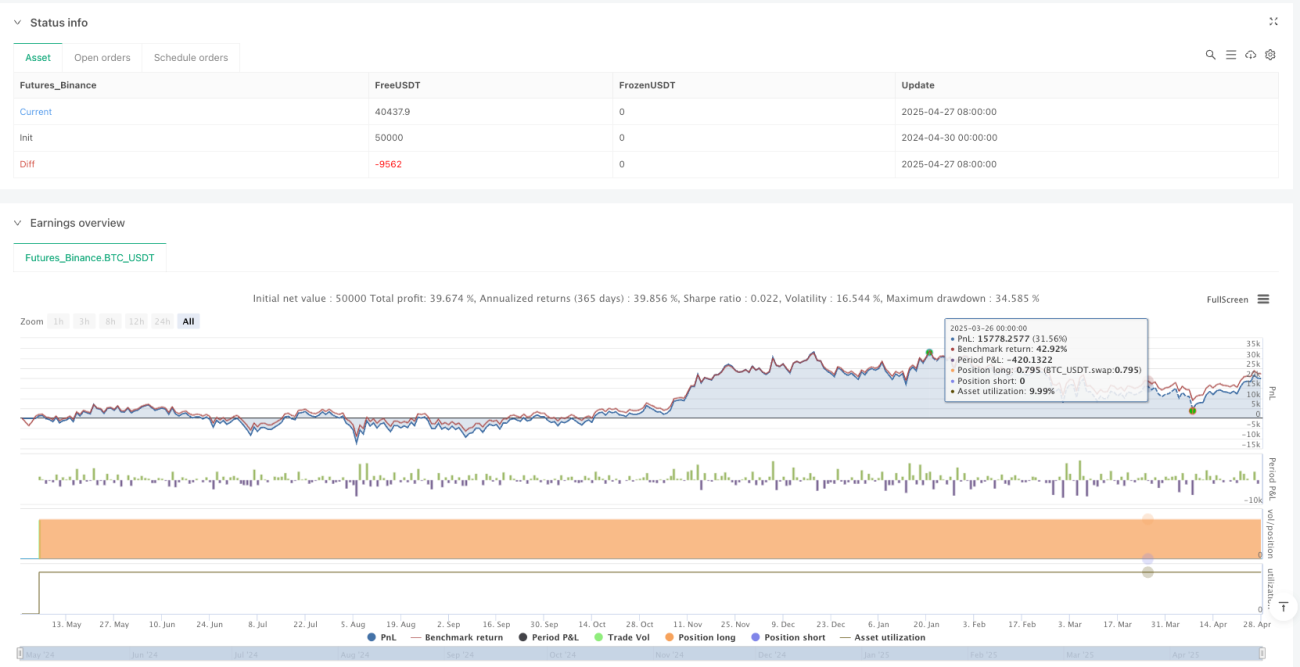
/*backtest
start: 2024-04-30 00:00:00
end: 2025-04-28 08:00:00
period: 1d
basePeriod: 1d
exchanges: [{"eid":"Futures_Binance","currency":"BTC_USDT"}]
*/

 //@version=5
strategy("EMA Trend Trading Strategy - Full", overlay=true, default_qty_type=strategy.percent_of_equity, default_qty_value=100, commission_type=strategy.commission.percent, commission_value=0.04)

// ==== 1. DETERMINE EMA TREND (H4) ====- 1