
Strategy Overview
The Precision Intraday Trading Strategy Based on Institutional Order Blocks and Fibonacci Retracements is a high-precision intraday trading system designed specifically for the US stock market, optimized for the 15-minute timeframe. This strategy combines institutional order flow concepts with Fibonacci retracement principles to identify high-probability price reversal points while implementing strict risk management and session-based rules.
The core of the strategy lies in identifying institutional order areas (Order Blocks) and using Fibonacci 61.8% or 79% retracement levels to find optimal entry points. By waiting for breakouts of stop-loss levels (liquidity sweeps), the strategy can confirm potential price reversals, providing more reliable trading signals. Strict time filtering ensures that the strategy only trades between 9:30 AM and 4:00 PM ET, with forced position closing at 4:30 PM, effectively avoiding overnight risk.
Strategy Principles
The core principles of this strategy are built on institutional order flow and price structure identification, with the specific operating mechanism as follows:
-
Strong Impulse Move Identification: The strategy first identifies strong impulse moves by looking for breakouts in price structure. When price forms a swing within a 5-candle period and the swing magnitude exceeds the product of ATR(14) and the minimum swing size, the system confirms a valid swing high or low.
-
Order Block Marking: After confirming a swing point, the strategy marks institutional order areas. When a swing low forms, that price level is marked as a bullish order block; when a swing high forms, that price level is marked as a bearish order block.
-
Fibonacci Retracement Confirmation: The strategy requires price to retrace to the 61.8% or 79% Fibonacci level, calculated from swing highs and lows. When price retraces to these key levels, the strategy begins looking for entry signals.
-
Time Filtering: All trading activity must occur between 9:30 AM and 4:00 PM ET, ensuring the strategy operates during the most active, liquid market sessions. No new positions are opened after 4:00 PM, and all positions are forcibly closed at 4:30 PM.
-
Entry Confirmation:
- Long Entry: When price touches a bullish order block and the closing price is above the 61.8% or 79% Fibonacci level, the system generates a long signal.
- Short Entry: When price touches a bearish order block and the closing price is below the 61.8% or 79% Fibonacci level, the system generates a short signal.
-
Risk Management Mechanism: The strategy uses ATR(14) to set stop-loss levels, ensuring risk is controlled within a reasonable range. For long trades, stops are placed below recent lows; for short trades, stops are placed above recent highs.
-
Fixed Risk-Reward Ratio: The strategy uses a default 2:1 risk-reward ratio to set take-profit levels, calculated by multiplying ATR(14) by the risk-reward parameter.
Strategy Advantages
Through deep analysis of the strategy code, we can summarize the following significant advantages:
-
Institution-Based Trading Logic: By identifying institutional order blocks and liquidity sweeps, the strategy can follow the direction of large capital movements, increasing the probability of successful trades.
-
Precise Time Management: Strict trading session restrictions ensure the strategy operates only during the most active market sessions, avoiding slippage and volatility risks that might occur during low liquidity periods.
-
Forced Close Mechanism: The daily 4:30 PM forced close rule effectively prevents overnight position risk, which is particularly important for markets with high intraday volatility.
-
Visualized Trading Signals: The strategy clearly marks trading signals through the graphical interface, using green triangles for long positions and red triangles for short positions, allowing traders to quickly identify potential trading opportunities.
-
Dynamic Risk Management: ATR-based stop-loss settings allow risk control to adjust automatically based on market volatility, maintaining consistent risk exposure in different volatility environments.
-
High Customizability: The strategy provides multiple key parameters for adjustment, including Fibonacci levels, minimum swing size, risk-reward ratio, etc., allowing traders to personalize settings according to their risk preferences and trading style.
-
Strict Entry Conditions: By combining multiple confirmation factors (order blocks, Fibonacci levels, valid trading times), the strategy effectively reduces false signals and improves trading quality.
Strategy Risks
Despite its many advantages, the strategy still presents some potential risks and challenges:
-
Over-Optimization Risk: The strategy relies on multiple precise parameter settings, such as Fibonacci levels, ATR multipliers, etc., which may risk over-optimization, leading to poor performance on out-of-sample data. The solution is to use a sufficiently long backtesting period and test the strategy's robustness in different market environments.
-
Rapid Trend Risk: In strong trending markets, price may not retrace to the specified Fibonacci levels, causing missed opportunities in potentially favorable trends. Consider adding a trend-following module or dynamically adjusting Fibonacci levels to address this issue.
-
Time Limitation Truncation Risk: The rules of no new positions after 4:00 PM and forced closing at 4:30 PM may force exits during favorable market conditions or forced closings at unfavorable prices. Consider introducing more flexible closing rules based on market conditions and position profit/loss status.
-
Swing Point Identification Lag: The strategy uses historical data (5 candles) to identify swing points, which may cause signal generation lag, missing optimal entry timing. Try optimizing the swing point identification algorithm or introducing other early indicators to improve signal timeliness.
-
Single Timeframe Limitation: Using only the 15-minute timeframe may ignore important market structures on larger or smaller time scales. Consider adding multi-timeframe analysis to provide a more comprehensive market perspective.
-
Fixed Risk-Reward Ratio Limitations: The uniform 2:1 risk-reward setting may not be suitable for all market environments, especially when volatility changes significantly. Consider dynamically adjusting the risk-reward ratio based on market volatility or support/resistance levels.
Strategy Optimization Directions
Based on in-depth analysis of the strategy code, here are several possible optimization directions:
-
Multi-Timeframe Confirmation: Introduce higher timeframe (such as 1-hour or 4-hour) trend confirmation to ensure intraday trading direction aligns with the larger trend, improving win rates. This optimization can be implemented by adding higher timeframe trend indicators or price structure analysis.
-
Dynamic Fibonacci Levels: Dynamically adjust Fibonacci retracement level requirements based on market volatility or current trend strength. Shallower retracements (like 38.2%) might be needed in strong trends, while deeper retracements (like 61.8% or 79%) might be required in oscillating markets.
-
Market State Adaptation: Introduce market state classification (trending, oscillating, high volatility, etc.) and adjust strategy parameters according to different market states. For example, wider stop-loss settings might be needed in high-volatility markets, while tighter stop-losses can be used in low-volatility markets to improve win rates.
-
Partial Profit Locking Mechanism: Introduce partial position closing when profit reaches specific levels, such as closing 50% of positions when profit reaches 1R, with trailing stops for the remaining portion, maximizing potential to capture large trend opportunities.
-
Volatility Indicator Filtering: Add volatility indicators such as ATR rate of change or Bollinger Band width to filter trading signals in low-volatility environments, avoiding overtrading in range-bound markets.
-
Volume Confirmation: Introduce volume analysis as an additional confirmation factor, ensuring price movements are supported by sufficient trading volume, improving signal reliability.
-
Machine Learning Enhancement: Use machine learning algorithms to analyze the effectiveness of order blocks and Fibonacci retracements in historical data, optimizing parameter settings or enhancing signal filtering accordingly.
-
Stop-Loss Optimization: The current strategy uses fixed ATR multiples to set stop-losses; consider using recent price structure (such as recent swing points) to set more precise stop-loss locations, both protecting capital and avoiding being shaken out of the market too early.
Conclusion
The Precision Intraday Trading Strategy Based on Institutional Order Blocks and Fibonacci Retracements represents a systematic trading approach that combines institutional trading behavior analysis with classic technical analysis tools, providing intraday traders with clear entry and exit rules.
The strategy's greatest advantage lies in its identification and utilization of institutional order flow, combined with strict time filtering and risk management rules, making it particularly suitable for intraday trading in the US stock market. The core trading concept focuses on finding high-probability reversal points where price retraces to key institutional order areas and Fibonacci levels, an approach that effectively balances trading frequency with signal quality.
The strategy's risks mainly come from challenges in parameter optimization and market environment adaptability, but through the proposed optimization directions, such as multi-timeframe confirmation, dynamic parameter adjustment, and market state adaptation, these risks can be effectively managed and mitigated.
Overall, this strategy provides a solid intraday trading framework suitable for traders with a certain understanding of institutional trading behavior. With reasonable parameter settings and optimization, it can maintain stable performance in different market environments. For traders looking for structured trading opportunities in intraday timeframes, this is a strategy worth considering.
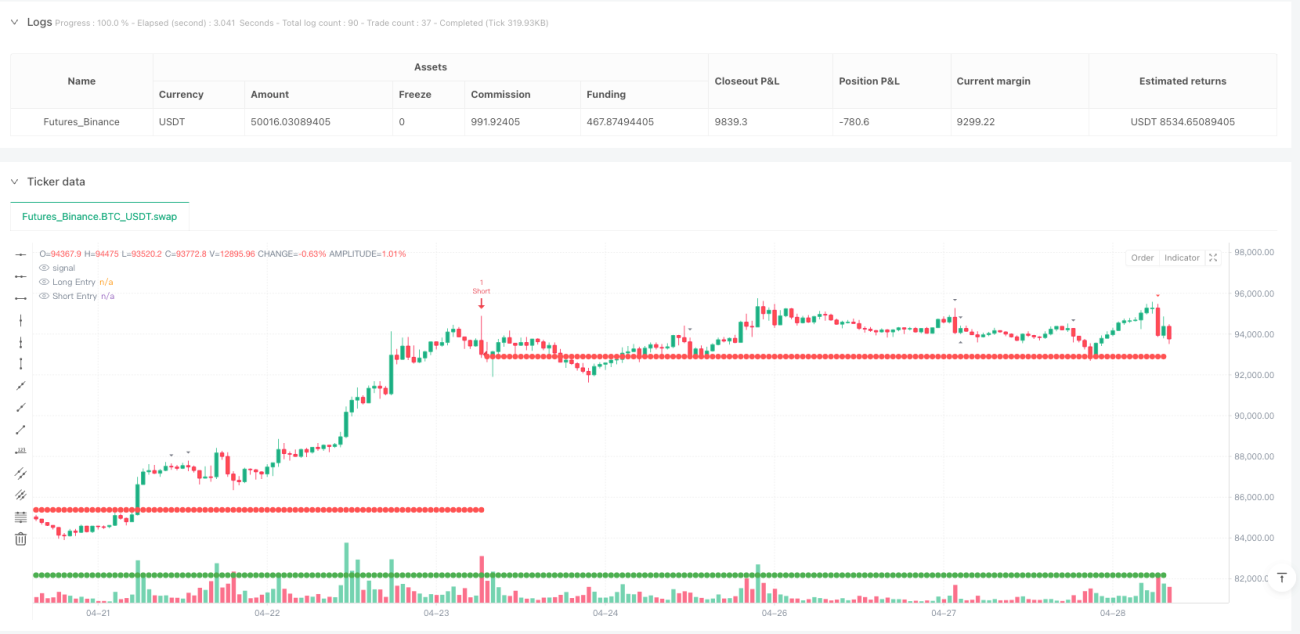
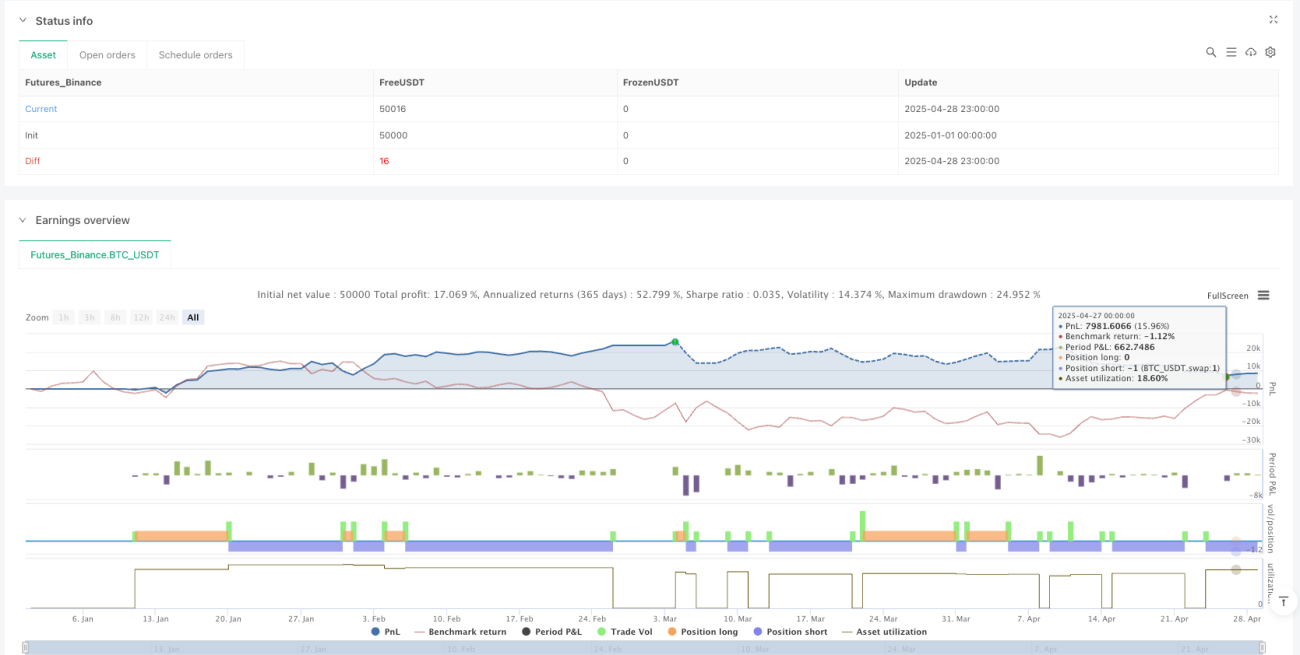
/*backtest
start: 2025-01-01 00:00:00
end: 2025-04-29 00:00:00
period: 1h
basePeriod: 1h
exchanges: [{"eid":"Futures_Binance","currency":"BTC_USDT"}]
*/

//@version=5
strategy("Rawstocks 15-Minute Model", overlay=true, margin_long=100, margin_short=100, pyramiding=0)

// ===== TIME CONTROL ===== (UTC-4 = Eastern Time)- 1