Multi-Frequency Dollar Cost Averaging Backtesting and Optimization Tool

Overview
The Multi-Frequency Dollar Cost Averaging Backtesting and Optimization Tool is a powerful strategy testing tool designed specifically for quantitative traders, primarily used to test and optimize the effectiveness of dollar-cost averaging strategies across different investment frequencies and amounts. This strategy allows users to flexibly choose investment frequency (daily, weekly, or monthly), investment amount, and time period, generating detailed analytical reports containing key metrics such as average purchase price, total investment, position size, current market value, and return rate through historical data backtesting. The core of the strategy lies in simulating regular fixed-amount investment behavior in a real investment environment, reducing market volatility risk through long-term continuous buying, and achieving value averaging investment.
Strategy Principles
The core principle of the Multi-Frequency DCA Backtesting Strategy is based on a time-driven automated investment mechanism. The strategy is implemented through the following key steps:
-
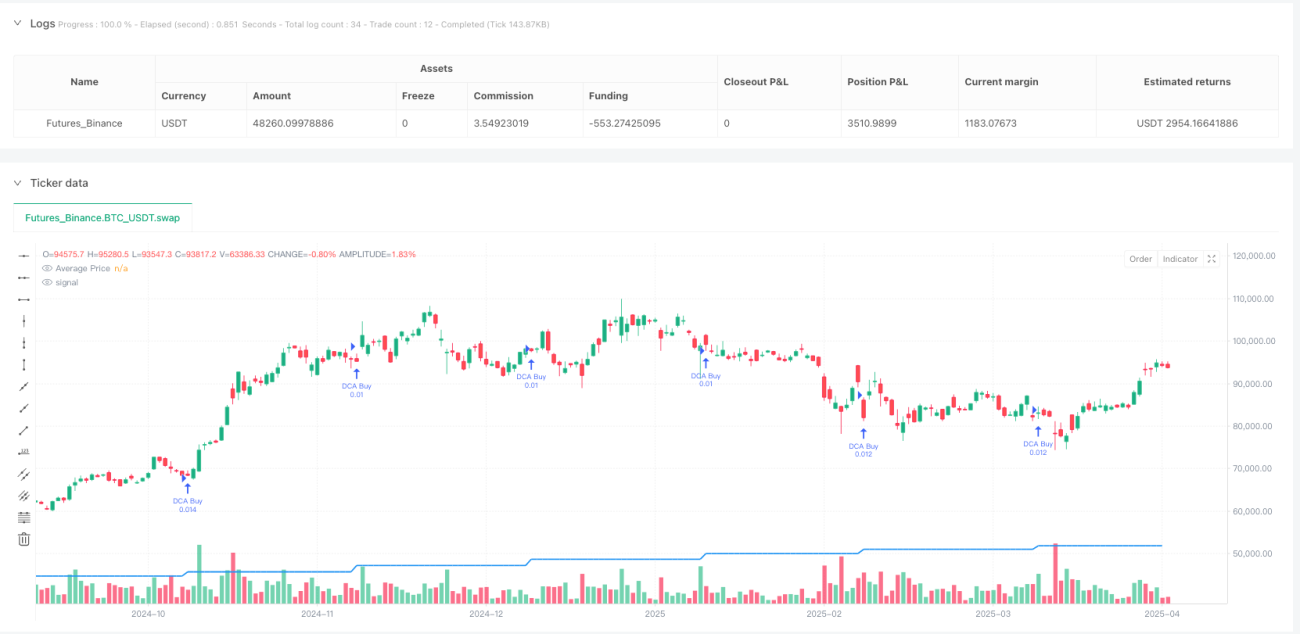
Frequency Setting: The strategy offers three DCA frequency options (daily, weekly, monthly), using the should_dca() function to determine whether the current time point meets the investment conditions. Daily frequency executes on each trading day; weekly frequency executes on Mondays; monthly frequency executes on a user-specified date each month.
-
Time Filtering: The strategy only executes DCA operations within the user-defined time range (from start_date to end_date), ensuring precise control during the backtesting period.
-
Position Management: During each DCA event, the system calculates the purchasable quantity based on the current price and fixed investment amount (shares_bought = investment_amount / close), adopting an investment approach with fixed amounts and variable quantities.
-
Data Tracking: The strategy maintains three key variables (total_invested, total_shares, and avg_price) to track investment total, holdings quantity, and average cost in real-time, providing data support for investment decisions.
-
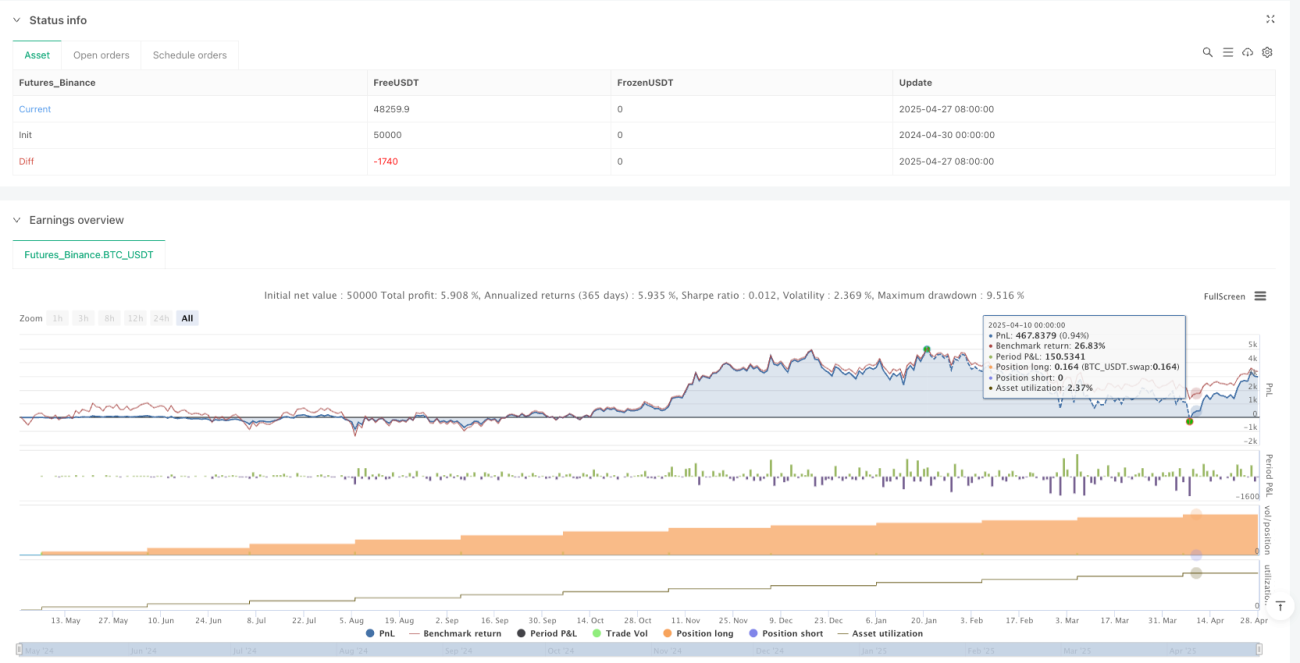
Return Calculation: The strategy calculates current market value (current_value = total_shares * close), unrealized profit (unrealized_profit = current_value - total_invested), and return on investment (roi_percent = unrealized_profit / total_invested * 100) in real-time, visually displaying investment performance.
-
Visual Display: The strategy uses the plot function to draw the average price line and uses tables to display key investment metrics, including total investment, position size, average price, current market value, and profit/loss status.
Strategy Advantages
The Multi-Frequency DCA Backtesting Strategy offers the following significant advantages:
-
High Flexibility: The strategy allows users to customize DCA frequency (daily/weekly/monthly), investment amount, and time range, meeting the personalized needs of different investors and adapting to various market environments and investment goals.
-
Automated Execution: The strategy automatically determines execution conditions through the should_dca() function without manual intervention, reducing the impact of emotional factors on investment decisions and ensuring consistent strategy execution.
-
Precise Fund Management: The strategy adopts a fixed-amount investment approach, precisely controlling the amount of funds invested each time, helping investors with strict financial planning and risk control.
-
Comprehensive Data Tracking: The strategy maintains and updates key investment metrics in real-time, including total investment, shares held, average cost, current market value, and return rate, providing investors with a comprehensive assessment of their investment status.
-
Intuitive Visual Feedback: Through the drawing of average price lines and real-time updated data tables, investors can intuitively understand the execution effect of the DCA strategy, especially the comparison between average cost and current price, helping to understand the effect of value averaging.
-
High Compatibility: The strategy design considers applicability across different time periods and asset classes. Whether for stocks, ETFs, or cryptocurrencies, this strategy can be used for DCA backtesting analysis.
Strategy Risks
Despite its many advantages, the Multi-Frequency DCA Backtesting Strategy still has the following potential risks during use:
-
Historical Data Bias: Strategy backtesting is based on historical data, with the risk of "survivorship bias," meaning backtesting results may be overly optimistic and unable to fully reflect future market performance. The solution is to conduct backtests across multiple time periods and market environments to increase sample diversity.
-
Parameter Sensitivity: Different DCA frequencies and investment amounts may produce drastically different backtesting results, with the risk of overfitting. It is recommended to conduct parameter sensitivity analysis to test the impact of parameter changes on strategy performance.
-
Insufficient Liquidity Consideration: The current strategy does not consider market liquidity factors and may not execute trades at expected prices for low-liquidity assets. Liquidity condition screening should be added, or slippage simulation set for low-liquidity markets.
-
Ignoring Transaction Costs: The strategy does not include transaction fees, taxes, and other cost factors, which may cause discrepancies between backtesting results and actual situations. It is recommended to add a transaction cost calculation module to more realistically simulate the investment environment.
-
Single Strategy Risk: A pure DCA strategy lacks market adaptability and may face significant drawdowns in prolonged bear markets. Consider combining technical or fundamental indicators to increase the strategy's market adaptability.
-
Capital Efficiency Issues: Fixed-frequency DCA may not fully utilize market lows, leading to inefficient use of capital. Consider adding price condition trigger mechanisms to increase investment amounts during significant price drops.
Strategy Optimization Directions
Based on an in-depth analysis of the current strategy, here are several potential optimization directions:
-
Dynamic Investment Amount: The current strategy uses a fixed investment amount, which could be optimized to a dynamic investment strategy based on market volatility. For example, increasing investment amounts during significant market downturns and decreasing during market upswings to better utilize market fluctuations. This method can improve capital utilization efficiency and capture more low-price buying opportunities.
-
Multi-Indicator Composite Triggers: Adding technical indicator trigger conditions on top of time triggers, such as combining Relative Strength Index (RSI), moving averages, and other indicators to increase investment intensity when technical indicators show oversold conditions. This can improve the strategy's market adaptability and avoid continuous buying in obviously overvalued areas.
-
Stop-Loss Mechanism Integration: The current strategy lacks risk control mechanisms. Adding stop-loss functionality based on drawdown magnitude or absolute loss amount can prevent continuous losses in extreme market environments. This is crucial for protecting investment principal.
-
Diversified Investment Functionality: Expanding the strategy to support simultaneous DCA in multiple assets, achieving automatic rebalancing of the investment portfolio. This approach can reduce single-asset risk and improve overall portfolio stability.
-
Exit Strategy Design: The current strategy focuses on buying decisions and lacks clear exit mechanisms. Adding exit conditions based on target return rates, holding periods, or fundamental changes can improve the full lifecycle management of the strategy.
-
Transaction Cost Simulation: Adding calculations for transaction fees, slippage, and taxes to make backtesting results closer to actual trading environments. This is important for evaluating strategy performance in real markets.
-
Enhanced Data Visualization: Adding more charts and indicators, such as ROI over time curves and frequency comparison analysis, to help users understand strategy performance more comprehensively. This not only improves the usability of the strategy but also helps users make more informed investment decisions.
Conclusion
The Multi-Frequency Dollar Cost Averaging Backtesting and Optimization Tool provides a comprehensive and flexible framework for testing and evaluating the performance of different DCA strategies in various market environments. By allowing users to customize DCA frequency, investment amount, and time range, this strategy can adapt to various investment styles and objectives.
The core advantages of this strategy lie in its simple yet powerful execution logic, automated DCA mechanism, and comprehensive data tracking and visualization features. Although there are potential risks such as historical data bias and parameter sensitivity, these risks can be effectively mitigated through the suggested optimization directions.
By introducing dynamic investment amounts, multi-indicator composite triggers, stop-loss mechanisms, and other optimizations, this strategy can further enhance its adaptability and effectiveness. In particular, diversified investment functionality and comprehensive exit strategy design will make it a more complete investment decision support tool.
For long-term investors, this strategy not only provides a systematic investment method but also helps investors understand and adhere to the investment philosophy of value averaging through intuitive data presentation. Whether experienced quantitative traders or beginners just starting their investment journey, this strategy tool can provide valuable insights and practical decision support.
/*backtest
start: 2024-04-30 00:00:00
end: 2025-04-28 08:00:00
period: 1d
basePeriod: 1d
exchanges: [{"eid":"Futures_Binance","currency":"BTC_USDT"}]
*/

//@version=6
strategy("DCA Strategy Tester", overlay=true, default_qty_type=strategy.percent_of_equity, default_qty_value=100, pyramiding = 999999)

// Strategy Parameters- 1