
Overview
The Multi-Dimensional Technical Breakout Trend Capture Strategy is a comprehensive quantitative trading system that combines multiple technical indicators with candlestick pattern recognition. This strategy integrates Exponential Moving Averages (EMA), Relative Strength Index (RSI), Moving Average Convergence Divergence (MACD), Average True Range (ATR), Average Directional Index (ADX), and higher timeframe analysis to identify high-probability market entry points. The strategy particularly emphasizes trading under conditions where multiple technical indicators confirm simultaneously, offering both strict and loose trading parameter configurations, and is best suited for 1-hour and 4-hour timeframes.
Strategy Principles
The core philosophy of the Multi-Dimensional Technical Breakout Trend Capture Strategy is to confirm trading signals through multi-layered technical screening. The strategy combines six key conditions, triggering trade signals only when a sufficient number of conditions are met:
-
EMA Cross Signal: The relative position of the fast EMA (9-period) to the slow EMA (21-period) confirms the short-term trend direction. Long signals require the fast EMA to be above the slow EMA, while short signals require the opposite.
-
Higher Timeframe Confirmation: The strategy compares the current price with the EMA on a higher timeframe (options from 15 minutes to daily) to ensure trade direction aligns with the larger trend. Longs require price above the higher timeframe EMA, shorts require price below it.
-
Dual RSI Confirmation: Both the current timeframe RSI and higher timeframe RSI jointly confirm momentum. Long signals require current RSI > 55 and higher timeframe RSI > 50, while short signals require current RSI < 45 and higher timeframe RSI < 50.
-
MACD Trend Confirmation: The relative position of MACD to its signal line validates trend direction. Long signals require MACD above the signal line, short signals require MACD below the signal line.
-
Volume Breakout Confirmation: Requires current volume to exceed 1.3 times (adjustable) the 20-period volume average, ensuring sufficient market participation supports the price movement.
-
Candlestick Pattern Confirmation: Identifies specific candlestick patterns, including bullish engulfing, hammer, inverted hammer, doji, inside bar (for longs), and bearish engulfing, shooting star, doji, inside bar (for shorts).
The strategy also incorporates an optional ADX trend filter, confirming the market is in a distinct trend only when ADX > 20. When executing trades, the system uses dynamic ATR-based stop-loss and take-profit levels, with stop-loss set at 1.5x ATR and take-profit at 3x ATR, providing a 2:1 reward-to-risk ratio.
Strategy Advantages
-
Multiple Confirmation Mechanism: By requiring multiple technical indicators to confirm simultaneously, the risk of false signals is significantly reduced. The strict mode requires all six conditions to be met, while the loose mode requires only four conditions, providing flexibility for traders.
-
Adaptive Risk Management: ATR-based dynamic stop-loss and take-profit settings automatically adjust according to market volatility, which is more adaptable to different market environments than fixed-point stops.
-
Timeframe Synergy: Combining current timeframe analysis with higher timeframe analysis ensures that trade direction aligns with the larger trend, increasing the probability of successful trades.
-
Volume Confirmation: By requiring volume breakouts to filter signals in low-liquidity environments, the system reduces erroneous trades when market interest is insufficient.
-
Trend Strength Filtering: The ADX filter ensures trading only in clear trends, avoiding ineffective trades in range-bound markets.
-
Visual Feedback: The strategy provides detailed chart markings, including entry signals, stop-loss and take-profit levels, and real-time strategy performance data, helping traders visually assess strategy effectiveness.
-
Candlestick Pattern Validation: By identifying classic candlestick patterns as additional confirmation, the strategy adds a price action analysis dimension, capturing key points of market sentiment change.
Strategy Risks
-
Over-Optimization Risk: The strategy involves multiple parameters and conditions, such as EMA periods, RSI thresholds, ATR multipliers, etc., risking overfitting to historical data, which could lead to diminished future performance. Multi-market, multi-period backtesting should be used to verify parameter stability.
-
Missed Trading Opportunities: Requiring all six conditions to be simultaneously met in strict mode may cause many potentially profitable trading opportunities to be missed. In less volatile markets, few moments will satisfy all conditions.
-
Stop-Loss Breach Risk: In highly volatile or low-liquidity markets, ATR-based stop-loss levels may be breached due to price gaps or slippage, resulting in actual losses exceeding expectations.
-
Signal Lag: Since the strategy uses multiple moving average-based indicators, there is some lag, potentially missing optimal entry points during early trend reversals or failing to exit timely.
-
Trading Frequency Limitations: The strategy sets trading session restrictions (2:00-20:00) and single position limits, which may cause good opportunities to be missed under certain market conditions.
-
Reliance on Technical Indicators: The strategy relies entirely on technical analysis, without considering fundamentals or market sentiment, potentially performing poorly during major news events or black swan events.
Strategy Optimization Directions
-
Machine Learning Parameter Optimization: Introduce machine learning algorithms to dynamically adjust the weights and thresholds of various indicators, adapting parameters to different market environments to enhance strategy adaptability.
-
Add Market Volatility Adjustment Mechanism: Dynamically adjust trading size and stop-loss distance based on volatility indicators like VIX or ATR rate of change, reducing position size in high-volatility markets and increasing it in low-volatility markets.
-
Integrate Market Sentiment Indicators: Introduce dimensions such as market fear indices, speculative sentiment indicators, or social media sentiment analysis to add a market psychology perspective to the strategy.
-
Add Time Filtering: Further refine trading session restrictions to avoid low-liquidity periods and important economic data release periods, reducing unnecessary noise trades.
-
Optimize Candlestick Pattern Recognition: The current candlestick pattern recognition is relatively simple; more complex and precise pattern recognition algorithms can be added, such as volatility-adjusted pattern definitions or machine learning pattern recognition.
-
Introduce Partial Position Management: The current strategy uses fixed percentage fund management (10% position); this can be optimized to dynamic position management based on win rates and risk-reward ratios using the Kelly formula, or implementing pyramid scaling to maximize favorable trends.
-
Integrate Multi-Timeframe Momentum: Extend existing higher timeframe analysis by adding consistency confirmation across more timeframes, trading only when trends across multiple timeframes align.
Summary
The Multi-Dimensional Technical Breakout Trend Capture Strategy is a comprehensive and rigorous quantitative trading system that effectively filters low-quality trading signals through a combination of multi-layered technical indicators and pattern recognition. The strategy is particularly suitable for medium to long-term timeframes (1-hour and 4-hour) and performs best in clear trends.
Its core advantages lie in its multi-dimensional confirmation mechanism and adaptive risk management system, while its main risks come from parameter optimization and market environment adaptability issues. Future optimization directions should focus on reducing strategy lag, improving parameter adaptability, and integrating more diverse market indicators.
For traders seeking systematic trading methods, this strategy provides a structured framework, but thorough backtesting and parameter optimization should be conducted before use to ensure suitability for specific trading markets and personal risk preferences. Through the optimization directions mentioned above, the strategy's robustness and adaptability across various market environments can be further enhanced.
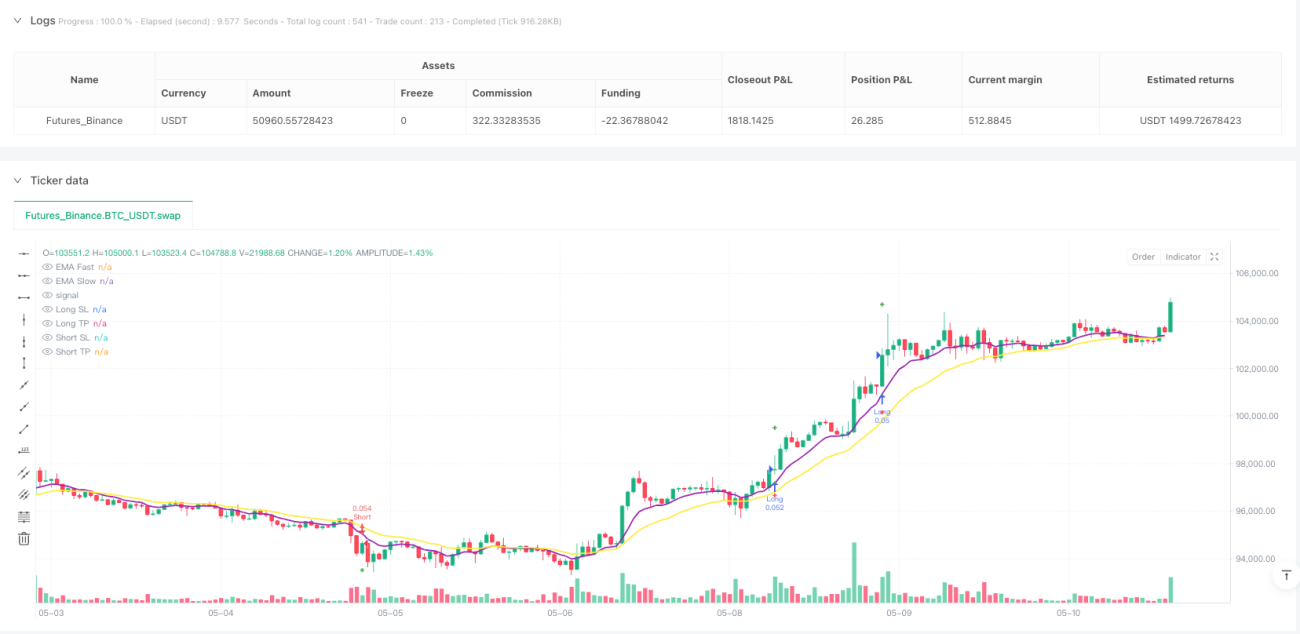
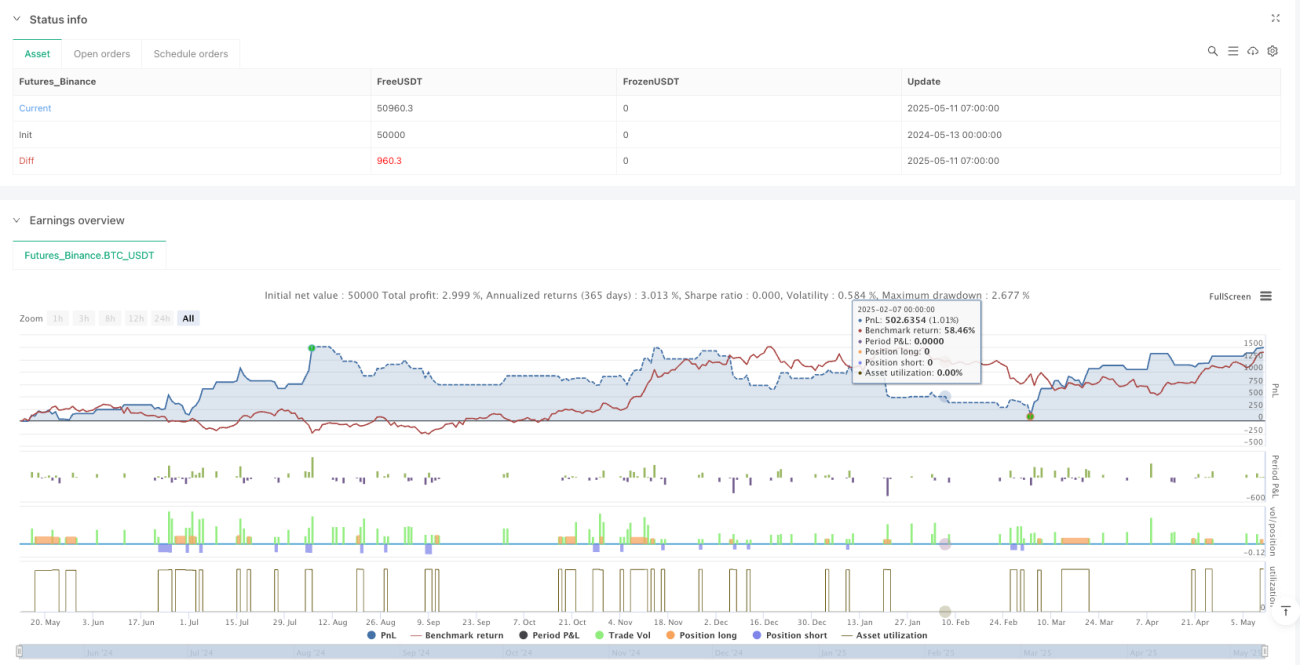
/*backtest
start: 2024-05-13 00:00:00
end: 2025-05-11 08:00:00
period: 1h
basePeriod: 1h
exchanges: [{"eid":"Futures_Binance","currency":"BTC_USDT"}]
*/

//@version=6
strategy("🚀 Sniper Entry Finder Enhanced [Backtest Enabled]", overlay=true, default_qty_type=strategy.percent_of_equity, default_qty_value=10)

// === USER INPUTS ===- 1