
Overview
The Time-Zone Optimized RSI Risk Management Quantitative Trading Strategy is an advanced trading system based on the Relative Strength Index (RSI) that combines precise time filtering and risk control mechanisms. The core of the strategy lies in identifying market reversal points through RSI overbought and oversold levels, while utilizing specific UTC time zone periods to filter trading signals, effectively avoiding inefficient trading sessions. The most significant feature of this strategy is the implementation of dynamic position sizing based on account risk percentage, ensuring scientific and consistent fund management. The system automatically sets fixed monetary stop-loss and take-profit levels for each trade, maintaining a stable risk-reward structure. This is a complete trading system suitable for traders who want to add strict risk management to their technical analysis foundation.
Strategy Principles
The core logic of this strategy is based on the following key modules:
-
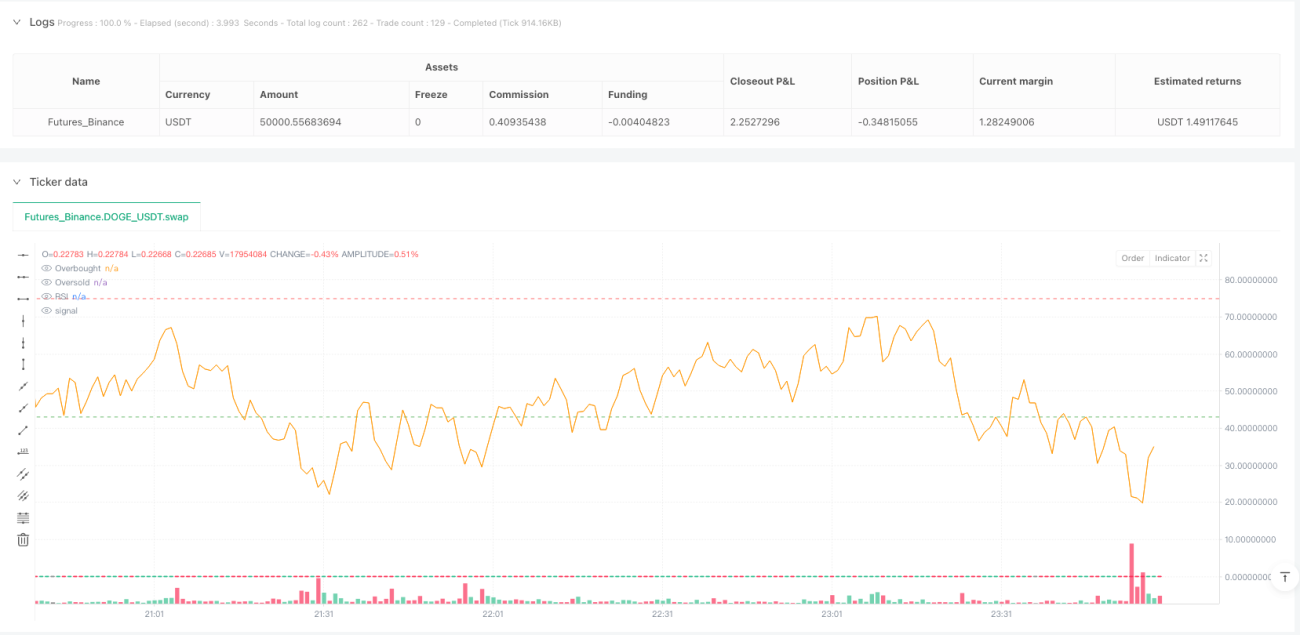
RSI Signal Generation: The strategy uses a standard 14-period RSI indicator but employs unconventional parameter settings - an overbought level of 75 and an oversold level of 43. Buy signals are triggered when RSI crosses above the 43 line, and sell signals when RSI crosses below the 75 line. This asymmetric setup suggests the strategy assumes a bullish market bias, giving more tolerance to long positions.
-
Time Filtering Mechanism: The strategy only generates trading signals between UTC hours 2 and 23. This time window covers the active trading sessions of major markets, effectively avoiding periods of lower liquidity. Time filtering is implemented through the
withinTimevariable, which is combined with RSI signal conditions using the "AND" operation, ensuring that RSI signals are only activated within the specified time window. -
Risk-Based Position Sizing: The strategy employs an advanced risk management method, risking a fixed percentage (default 1%) of the account equity per trade. The specific calculation formula is:
riskAmount = capital * (riskPercent / 100) positionSize = riskAmount / (sl_pips * tickValue)This ensures that regardless of account size changes, the risk exposure per trade remains consistent.
-
Precise Stop-Loss and Take-Profit Settings: The strategy sets fixed point stop-loss (9.0) and take-profit (16.5) for each trade. These levels are calculated directly based on entry price, rather than being dynamically adjusted based on volatility or other market conditions. The take-profit level (16.5) is greater than the stop-loss level (9.0), achieving a positive risk-reward ratio of approximately 1:1.83.
-
Trade Execution Logic: When buy conditions are met, the system enters a long position at market price and immediately sets stop-loss and take-profit orders. Similarly, when sell conditions are met, the system enters a short position and sets corresponding stop-loss and take-profit orders. This execution method ensures that each trade has a predefined exit strategy.
Strategy Advantages
After in-depth analysis, this strategy has the following significant advantages:
-
Complete Risk Management Framework: The strategy's greatest advantage lies in its sound risk management system. By limiting the risk of each trade to a fixed percentage of the account equity and dynamically calculating position size, the strategy effectively controls the risk exposure of individual trades, preventing excessive trading and improper fund management.
-
Time Filter Enhancement: The time zone filter significantly improves the strategy's efficiency by limiting trading activity between UTC 2 and 23, avoiding periods of low liquidity and potentially irregular volatility. This reduces the risk of false signals and slippage.
-
Clear Trading Rules: The strategy rules are clear and explicit, leaving no room for subjective judgment. Entry, exit conditions, and position size are all systematically calculated, making the strategy easy to backtest and implement in live trading.
-
Positive Risk-Reward Ratio: The strategy's default take-profit level (16.5) is greater than the stop-loss level (9.0), creating a risk-reward ratio of approximately 1:1.83. This means that even with a win rate of only 50%, the strategy can achieve profitability in the long run.
-
Dynamic Position Adjustment: As the account size grows, trade size automatically adjusts, ensuring that risk levels remain consistent while allowing profits to compound with account growth.
Strategy Risks
Despite its many advantages, the strategy also has risks that need attention:
-
Limitations of Fixed Point Stop-Loss: The strategy uses a fixed point (9.0) as stop-loss, rather than dynamically adjusting based on market volatility. In market environments with sudden increases in volatility, this may lead to stop-losses being too small and easily triggered by market noise. A solution could be to introduce dynamic stop-loss settings based on ATR (Average True Range).
-
RSI Limitations: As a momentum indicator, RSI can produce continuous overbought or oversold signals in strong trending markets. Especially in one-sided trend markets, this may lead to multiple losing trades. Consider adding a trend filter (such as moving averages) to avoid counter-trend trading in strong trends.
-
Regional Limitations of Time Filtering: The current time filtering is based on UTC time, which may not be suitable for all markets or traders' time zones. For different global markets, the trading time window may need to be adjusted according to the active sessions of specific markets.
-
Fixed Risk Assessment Parameters: The strategy defaults to risking 1% of the account per trade, which may be too conservative or too aggressive for some traders. This parameter should be adjusted according to individual risk tolerance and market conditions.
-
Lack of Market Condition Adaptability: The strategy does not differentiate between different market environments (such as trending, ranging, or high volatility), applying the same rules under all market conditions. Introducing a market state recognition mechanism could improve the strategy's adaptability.
Strategy Optimization Directions
Based on code analysis, here are possible optimization directions:
-
Introduce Dynamic Volatility Adjustment: Replace fixed point stop-loss and take-profit with dynamic settings based on ATR. For example:
            atrPeriod = input(14, "ATR Period")
atrMultiplierSL = input(1.5, "ATR Multiplier for SL")
atrMultiplierTP = input(2.8, "ATR Multiplier for TP")
atrValue = ta.atr(atrPeriod)

long_sl = close - atrValue * atrMultiplierSL
long_tp = close + atrValue * atrMultiplierTP
This would allow stop-loss and take-profit levels to automatically adapt to market volatility, setting wider stops in increased volatility and tighter stops in decreased volatility.
-
Add Trend Filters: Combine trend indicators such as moving averages, only trading in the direction of the trend:
            ema200 = ta.ema(close, 200)
longCondition = buySignal and close > ema200
shortCondition = sellSignal and close < ema200
This helps avoid frequent counter-trend trading in strong trends.
-
Optimize RSI Parameters: The current RSI overbought and oversold settings (75 and 43) are asymmetric. These parameters can be optimized through historical data or dynamically adjusted according to market conditions. For example, use more extreme RSI settings in oscillating markets and milder settings in trending markets.
-
Market State Recognition: Add logic to identify different market states and apply different trading parameters for different states:
volatility = ta.stdev(close/close[1] - 1, 20) * 100 highVolMarket = volatility > ta.sma(volatility, 100) * 1.5 // Adjust parameters in high volatility markets effectiveRiskPercent = highVolMarket ? riskPercent * 0.7 : riskPercent -
Add Multiple Timeframe Analysis: Add filters on higher timeframes to ensure trade direction aligns with the larger trend:
            higherTimeframeClose = request.security(syminfo.ticker, "240", close)
higherTimeframeRSI = request.security(syminfo.ticker, "240", ta.rsi(close, rsiPeriod))

longFilter = higherTimeframeRSI > 50
shortFilter = higherTimeframeRSI < 50

buySignalFiltered = buySignal and longFilter
sellSignalFiltered = sellSignal and shortFilter
This approach can reduce counter-trend trading and improve overall success rates.
Summary
The Time-Zone Optimized RSI Risk Management Quantitative Trading Strategy is a well-structured trading system that successfully integrates technical analysis and risk management principles. Its core strength lies in combining RSI signal generation, time filtering, and risk-based dynamic position management. This strategy is suitable for traders with a basic understanding of technical trading who wish to implement strict risk controls.
The main limitations of the strategy are that fixed parameter settings may lack adaptability to different market environments, and RSI reversal signals in strong trending markets may lead to consecutive losses. To enhance strategy performance, it is recommended to add trend filtering, dynamic volatility adjustment, and market state recognition mechanisms.
Overall, this is a conceptually sound trading strategy framework, particularly suitable for risk-conscious traders. Through targeted optimization and personalization, this strategy can become a reliable trading tool. The success of the strategy depends not only on the trading signals it generates but more importantly on its strict risk management framework, which distinguishes it from many trading systems that focus only on entry signals while neglecting risk control.
- 1