
Overview
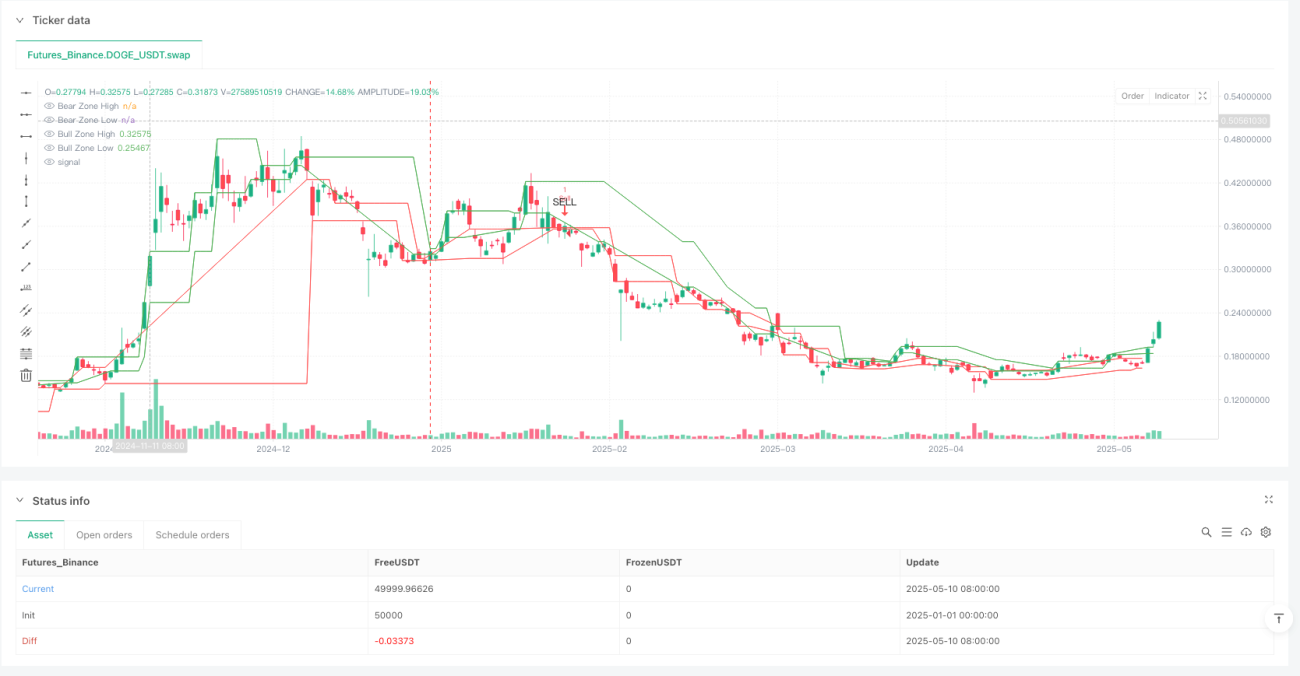
The Advanced Displacement Zone Quantitative Trading Strategy is an automated trading system based on candlestick technical analysis. Its core concept is to identify specific displacement candlestick patterns and generate trading signals when price enters these displacement zones. The strategy analyzes the relationship between the candle body and wicks, combined with price action, to find potential buying and selling opportunities in the market. The strategy sets fixed take profit (12 points) and stop loss (1 point) levels to implement risk control and profit locking.
Strategy Principles
The core principle of this strategy is to identify and utilize "Displacement Zones" - special price ranges for trading. Specifically:
-
Displacement Candle Identification: The strategy first identifies bullish and bearish displacement candles through the
isBullishDisplacement()andisBearishDisplacement()functions. These candles are characterized by bodies larger than their wicks by a specific multiple (controlled by the sensitivity parameter). -
Doji Exclusion: The
isDoji()function filters out high-uncertainty doji candles, focusing only on clear trend signals. A doji is defined when the body-to-range ratio is less than the set threshold (default 10%). -
Displacement Zone Construction: The strategy records the highs or lows of the two most recent bullish or bearish displacement candles, using these to construct the upper and lower boundaries of displacement zones.
-
Zone Status Tracking: State variables (
inBearZoneandinBullZone) track whether the price is within a displacement zone. -
Entry Signal Generation: Trading signals are generated when price enters a displacement zone from a specific direction:
- Buy signal: Price was above the bullish displacement zone's upper boundary and subsequently enters the zone
- Sell signal: Price was below the bearish displacement zone's lower boundary and subsequently enters the zone
-
Automated Trade Execution: Once a signal is triggered, the strategy automatically executes trades and sets fixed take profit (12 points) and stop loss (1 point) positions.
Strategy Advantages
Analyzing the code of this strategy, we can summarize the following significant advantages:
-
Clear Logic Based on Price Structure: The strategy is based on candlestick patterns and displacement zone concepts, making the trading logic intuitive, clear, and easy to understand and apply.
-
Parameterized Flexibility: Through two adjustable parameters - sensitivity multiplier and doji threshold - the strategy can adapt to different market environments and personal risk preferences.
-
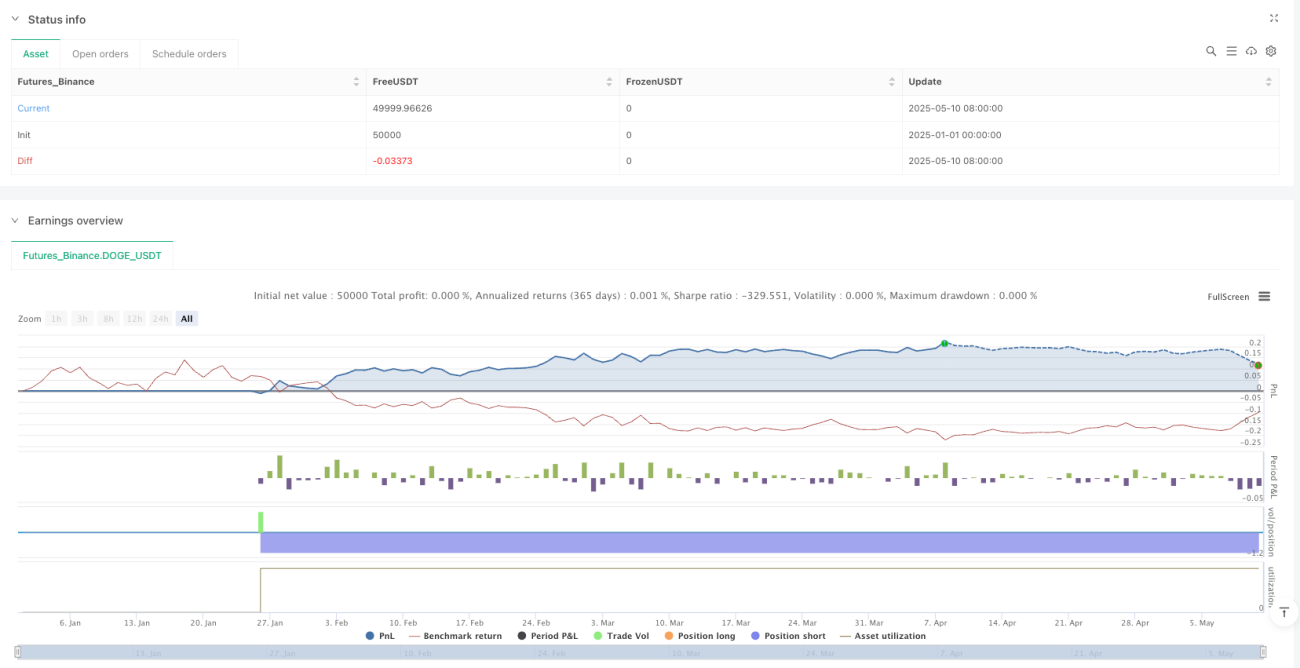
Automated Risk Management: Built-in fixed stop-loss and take-profit mechanisms with a risk-reward ratio of 12:1 for each trade, contributing to long-term stable money management.
-
Visualized Trading Signals: The strategy clearly displays buy/sell signals and displacement zone boundaries through graphical markers, making it easy for traders to intuitively understand market conditions.
-
Combining Breakout and Pullback Strategies: It not only identifies displacement zones but also incorporates the technical analysis concept of price breakout followed by pullback, improving signal quality.
-
Avoiding Market Noise: By filtering out doji patterns, it reduces false signals in uncertain market environments.
Strategy Risks
Despite its reasonable design, the strategy still has the following potential risks:
-
Small Stop Loss Risk: The strategy's stop loss is set at only 1 point, which may be too tight in highly volatile markets and easily triggered by market noise, leading to frequent stops. Solution: Adjust the stop loss multiplier based on the volatility characteristics of the trading instrument.
-
Parameter Sensitivity: Improper sensitivity multiplier settings may lead to too many or too few signals. Solution: Optimize parameters through backtesting to find the best parameter combination for specific market environments.
-
Consecutive Loss Risk: In oscillating markets, displacement zones may form frequently but fail to develop into trends, resulting in consecutive stop losses. Solution: Add market environment filtering conditions, such as trend indicator confirmation.
-
Lack of Dynamic Stop Loss: Fixed stop loss may not adapt to changes in market volatility. Solution: Implement a dynamic stop loss mechanism based on ATR or volatility.
-
Over-reliance on Historical Displacement Points: The strategy only records the two most recent displacement points, potentially ignoring longer-term price structures. Solution: Consider extending the time range for recording displacement points.
Strategy Optimization Directions
Based on code analysis, the strategy has several optimization directions:
-
Dynamic Risk Management: Change fixed take profit and stop loss levels to dynamic settings based on ATR (Average True Range) to adapt to different market volatility environments. This benefits by reducing premature stops during low volatility periods and providing adequate protection during high volatility periods.
-
Add Time Filtering: Incorporate time validity checks in the strategy; if displacement zones form but don't trigger signals for an extended period, they should be reset or their importance reduced. This avoids making trading decisions based on outdated information.
-
Introduce Volume Confirmation: Use volume as an auxiliary indicator for signal confirmation, accepting signals only when volume increases, thereby improving trade quality. Volume helps verify the validity of price action.
-
Multi-timeframe Analysis: Combine signals from the current timeframe with trend directions from higher timeframes, trading only when directions align to improve win rates.
-
Adaptive Parameter System: Implement a mechanism that automatically adjusts sensitivity parameters based on recent market behavior, allowing the strategy to adapt to market transitions. This is because different market phases (trend, range-bound) require different parameter settings.
-
Add Consecutive Loss Protection: Design a mechanism that pauses trading or adjusts parameters after a specific number of consecutive stop losses, avoiding continued losses in unfavorable market conditions.
Summary
The Advanced Displacement Zone Quantitative Trading Strategy is a systematic trading method based on price structure and candlestick patterns, generating trading signals by identifying specific displacement candles and price action patterns. The strategy controls risk through fixed take profit and stop loss mechanisms and aids trading decisions through visualization tools.
The strategy's main advantages are clear logic, flexible parameters, and automated risk management, but it also has potential risks such as small stop loss settings and parameter sensitivity. By introducing dynamic risk management, time filtering, volume confirmation, multi-timeframe analysis, and adaptive parameter systems, the robustness and profitability of the strategy can be significantly enhanced.
For investors seeking systematic trading based on technical analysis, the Advanced Displacement Zone Strategy provides a framework worth considering, especially when combined with relevant optimizations, making it more likely to maintain stable performance across different market environments.
- 1