ATR Dynamic Trailing Stop Loss Quantitative Trading Strategy

Overview
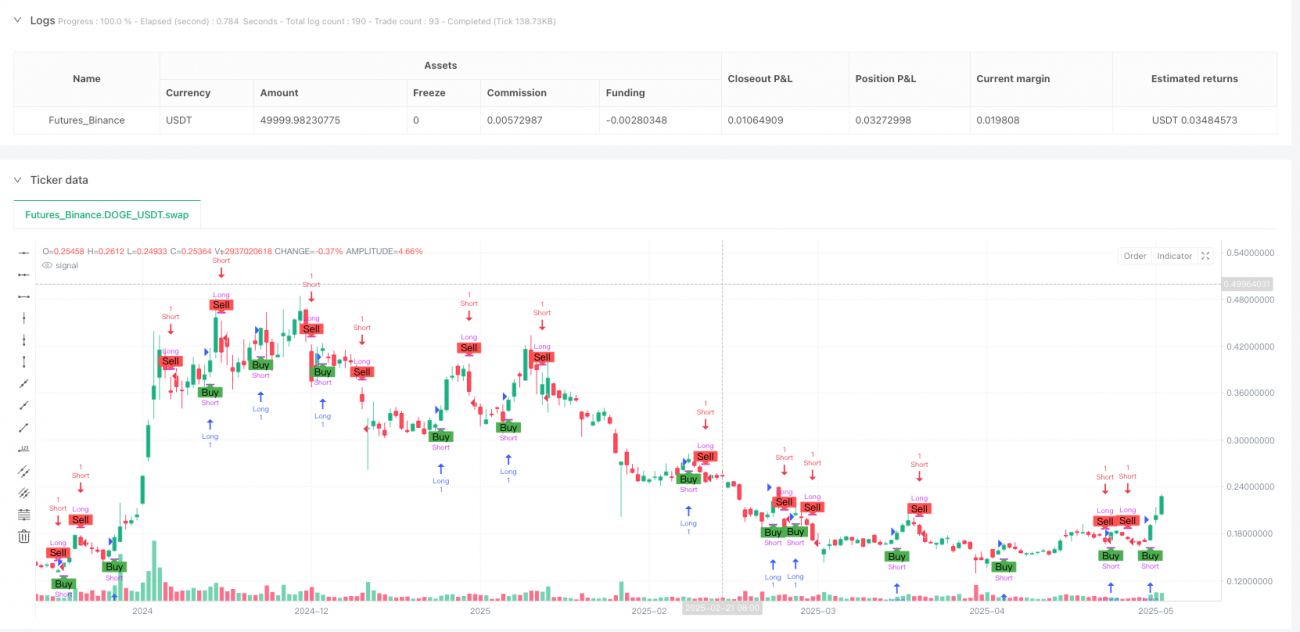
This strategy is a dynamic trailing stop-loss trading system based on the Average True Range (ATR) indicator, combined with EMA filter signals, primarily used to capture market trend reversal points and execute trades. The core of the strategy is to calculate dynamic stop-loss levels through ATR values, triggering trading signals when price crosses these stop-loss levels. The strategy is designed to backtest within a specific date range and is particularly suitable for running on 15-minute timeframes with Heikin Ashi candles, helping to reduce noise and identify trend changes more clearly.
Strategy Principles
The core logic of this strategy is based on a dynamic trailing stop system built with the ATR indicator. The specific working principles are as follows:
- Calculate the current ATR value (default period of 10) and multiply it by a sensitivity parameter (default 1.0) to get the stop-loss range (nLoss)
- Establish a dynamic trailing stop line (xATRTrailingStop), which automatically adjusts according to price movements:
- When prices are continuously rising, the stop line moves up but maintains a position at "price - stop-loss range"
- When prices are continuously falling, the stop line moves down but maintains a position at "price + stop-loss range"
- When the price breaks through the stop line, the stop line reverses direction
- Use EMA(1) as the basis for judging crosses between smoothed price and the trailing stop line
- Generate trading signals:
- Buy signal: when EMA crosses above the trailing stop line and price is above the stop line
- Sell signal: when EMA crosses below the trailing stop line and price is below the stop line
- The strategy only executes trades within the set date range, automatically closing positions and canceling all pending orders outside this range
The entire trading logic is similar to a trend-following system, but by dynamically adjusting stop-loss positions through ATR, the strategy can adapt to different volatility environments.
Strategy Advantages
Through in-depth analysis of the strategy code, I have summarized the following significant advantages:
- Strong Adaptability: Using the ATR indicator to calculate stop-loss distances allows the strategy to automatically adapt to different market volatility environments, providing wider stop-loss space in high-volatility markets and tighter stop-loss in low-volatility markets
- Effective Trend Following: The trailing stop mechanism allows profits to continue growing while protecting realized profits, particularly suitable for capturing medium to long-term trends
- Simplified Parameters: Only a few parameters (sensitivity and ATR period) need adjustment to adapt to different markets and instruments, reducing the risk of over-optimization
- Clear Signals: Trading signals are clear with no ambiguous zones, facilitating automated execution
- Built-in Stop Loss: The strategy itself includes a dynamic stop-loss mechanism, eliminating the need for additional stop-loss conditions
- Time Filtering: Features date range filtering functionality, allowing focus on specific time periods for backtesting, avoiding historical data bias
- Bidirectional Trading: Supports both long and short trading, able to fully utilize market opportunities
- Visual Aids: Intuitively displays trading signals through bar colors and markers, facilitating analysis and review
Strategy Risks
Despite its many advantages, this strategy still has the following risks in practical application:
- Poor Performance in Ranging Markets: In sideways consolidating markets, frequent price crossings of the trailing stop line will lead to frequent trading and "sawtooth" losses (high-frequency trading fees and consecutive small losses)
- Parameter Sensitivity: Improper setting of the sensitivity parameter (keyValue) will significantly affect strategy performance:
- Too small will cause stops to be too tight, easily triggered by market noise
- Too large may cause stops to be too wide, failing to stop losses in time and increasing losses
- EMA(1) Close to Original Price: Using an EMA with a period of 1 is almost identical to the original price and may not effectively filter market noise
- Lack of Other Confirmation Indicators: Relying solely on a single indicator system without confirmation from other technical indicators may increase the risk of false signals
- Fixed Position Management: The code lacks a dynamic position management mechanism and cannot automatically adjust trading size based on market conditions or account equity
- Fixed Backtesting Period: For real-time trading, manual adjustment of the date range is required, increasing operational complexity
- Lack of Take Profit Mechanism: The strategy mainly relies on trend reversals to close positions without a clear take-profit mechanism, potentially giving back too much profit at the end of trends
Solutions:
- Add oscillation indicators (such as RSI or Bollinger Bands) to filter signals in ranging markets
- Adjust sensitivity parameters based on different market characteristics and timeframes
- Consider using longer-period EMAs to smooth prices
- Add volume or other technical indicators as signal confirmation conditions
- Implement dynamic position management, adjusting trading size based on market volatility or account equity
Strategy Optimization Directions
Based on code analysis, the strategy can be optimized in the following directions:
-
Enhanced Signal Filtering:
- Add trend identification indicators (such as longer-period moving averages), only trading in the trend direction
- Introduce oscillation indicators (such as RSI or stochastic indicators) to filter signals in ranging markets
- Consider adding volume confirmation to improve signal quality
-
Dynamic Parameter Adjustment:
- Automatically adjust sensitivity parameters based on historical volatility, rather than using fixed values
- Use adaptive ATR periods, automatically adjusting in different market phases
-
Position Management Optimization:
- Implement ATR-based dynamic position management, reducing position size in high-volatility environments
- Add scaled entry and exit mechanisms to reduce the risk of single-point market entry and exit
-
Add Take Profit Mechanism:
- Design partial profit locking mechanisms, such as scaled exits or trailing take-profits
- Set take-profit points based on target profit rates or volatility multiples
-
Time Filtering Improvements:
- Add market trading session filters to avoid low-liquidity periods
- Add weekly or monthly seasonality filtering conditions
-
Multi-Timeframe Analysis:
- Combine trend judgments from higher timeframes for multi-timeframe confirmation
- Adjust trading direction preferences based on higher timeframe trends
These optimization directions are important because they can significantly improve the robustness of the strategy. In particular, adding signal filtering and dynamic parameter adjustment can reduce false signals, while improving position management and take-profit mechanisms can optimize capital efficiency and risk-reward ratios.
Conclusion
The ATR Dynamic Trailing Stop Loss Quantitative Trading Strategy is an elegantly designed trend-following system that creates a dynamic stop-loss mechanism adaptable to market volatility by combining the ATR indicator with EMA. The strategy's greatest advantages lie in its adaptability and simplicity, automatically adjusting stop-loss distances under various market conditions while maintaining clear operational logic.
However, the strategy may underperform in ranging markets and relies too heavily on a single indicator system. By adding additional signal filtering, optimizing parameter adjustment mechanisms, improving position management, and adding take-profit strategies, its performance can be significantly enhanced.
For traders, this is an excellent basic strategy framework that can be customized and expanded according to personal trading styles and target market characteristics. It is recommended to thoroughly backtest different parameter combinations and market environments before live application, and consider combining other technical indicators to form a more comprehensive trading system.
This strategy is particularly suitable for markets with obvious medium to long-term trends, providing traders with a relatively simple but effective quantitative trading solution by allowing profits to continue growing while dynamically protecting realized gains.
- 1