
Overview
The Trend Following Dual Indicator Confluence Automated Trading Strategy is a trend-following system that combines the Average Directional Index (ADX) and Moving Average Convergence Divergence (MACD) indicators. The core concept of this strategy is to confirm market trend direction through the confluence of two powerful indicators and enter positions when trends are established. The system features built-in Stop Loss (SL) and Take Profit (TP) risk management functions and is fully compatible with PineConnector for real-time trade automation via MT4/MT5. This strategy particularly emphasizes signal quality, triggering trade signals only when ADX indicates a strong trend and both Directional Indicators (DI) and MACD simultaneously confirm the direction.
Strategy Principles
The core principle of this strategy is based on the synergistic effect of two key technical indicators:
-
ADX (Average Directional Index) and Directional Index (DI) - ADX measures trend strength regardless of direction, while +DI and -DI indicate the strength of upward and downward trends respectively. The strategy requires the ADX value to exceed a preset threshold (default 25) before considering entry, ensuring trading only occurs in clearly defined trends.
-
MACD (Moving Average Convergence Divergence) - As a momentum indicator, MACD confirms price momentum by comparing fast and slow moving averages. When the MACD line is above the signal line, it indicates upward momentum; conversely, it indicates downward momentum.
The precise entry conditions are as follows:
- Long Entry: When +DI is greater than -DI, MACD line is greater than signal line, and ADX is above the set threshold
- Short Entry: When -DI is greater than +DI, MACD line is less than signal line, and ADX is above the set threshold
For risk management, the strategy automatically sets percentage-based stop loss and take profit levels at each entry. When the price reaches the preset stop loss or take profit level, the system automatically closes the position without manual intervention. This mechanism effectively controls risk exposure for each trade, preventing small losses from evolving into larger ones.
Strategy Advantages
-
Dual Confirmation Mechanism - Confirmation through two independent indicators, ADX/DI and MACD, significantly reduces false signals and improves win rate. Single indicators may easily generate false signals, while confirmation from two indicators greatly increases signal reliability.
-
Trend Strength Filtering - The ADX threshold filter ensures the strategy only enters during strong trends, avoiding unnecessary trades in ranging markets, reducing trading frequency but improving signal quality.
-
Automated Risk Management - Built-in stop loss and take profit functions make risk management a core component of the strategy rather than an afterthought. The risk-reward ratio for each trade is determined before entry, helping maintain consistent money management discipline.
-
Visualized Trading Signals - The strategy provides rich visual feedback, including colored candlesticks showing trend direction, entry signal markers, and stop loss/take profit projection lines, allowing traders to intuitively understand market conditions and strategy logic.
-
Real-time Automated Trading Capability - Through PineConnector integration, the strategy can achieve fully automated trade execution without manual intervention, eliminating emotional factors and execution delays.
Strategy Risks
-
Trend Reversal Risk - Despite using the ADX filter, trend-following strategies are inherently susceptible to sudden trend reversals. In highly volatile markets, even strong trends can suddenly reverse, triggering stop losses. Mitigation: Consider incorporating market volatility indicators (such as ATR) to adjust stop loss levels, or reduce position size during periods of high volatility.
-
Parameter Sensitivity - Strategy performance is highly dependent on parameter settings such as ADX length, MACD parameters, and ADX threshold. Different markets and timeframes may require different optimal parameters, and incorrect parameter settings may lead to overtrading or missed opportunities. Mitigation: Conduct thorough backtesting to find optimal parameters for specific markets and timeframes, and periodically reassess these parameters.
-
Fixed Percentage Stop Loss Limitation - Using fixed percentage stops may not adapt to changes in market volatility. During high volatility periods, stops may be too tight; during low volatility periods, stops may be too loose. Mitigation: Consider dynamic ATR-based stops that automatically adjust to current market volatility.
-
Lagging Signal Risk - Both ADX and MACD are lagging indicators that may signal only after a trend has been established for some time, resulting in late entries that miss a significant portion of the trend. Mitigation: Consider incorporating some leading indicators as supplements, or adjusting parameters to reduce lag, accepting potentially increased false signals as a trade-off.
-
Technical Dependency - Relying on third-party tools like PineConnector for automated trading introduces additional technical risk points. Connection issues, delays, or execution errors may affect strategy performance. Mitigation: Establish robust monitoring systems and backup trading plans, and regularly check system connections and execution status.
Strategy Optimization Directions
-
Dynamic Parameter Adjustment - The current strategy uses fixed ADX and MACD parameters. An important optimization direction is to implement dynamic parameter adjustment, automatically optimizing indicator parameters based on market volatility and trend status. For example, longer periods may be needed to filter noise in high volatility markets, while shorter periods may be needed to capture more signals in low volatility markets.
-
Volatility-Adaptive Stop Loss - Upgrade fixed percentage stops to an ATR-based dynamic stop loss system. This would adapt stop loss levels to current market conditions, providing looser stops when volatility increases and tighter stops when volatility decreases. Such optimization can significantly improve the strategy's risk-adjusted returns.
-
Trend Strength Graduation - The current strategy uses a simple binary judgment (ADX above or below threshold) to determine trend strength. An optimization direction is to establish a trend strength graduation system, adjusting position size according to different ADX value ranges. For example, higher ADX values indicate stronger trends, allowing for increased position sizes; conversely, lower values would reduce position size or avoid trading.
-
Multi-Timeframe Analysis - Introduce a multi-timeframe confirmation mechanism, requiring the trend direction in higher timeframes to align with the trading timeframe. This would reduce the risk of trading against major trends and improve overall win rates. For example, long signals on a 1-hour chart may be more reliable when both daily and 4-hour charts show an uptrend.
-
Machine Learning Optimization - A long-term optimization direction could involve incorporating machine learning algorithms to predict the reliability of ADX and MACD signals. By analyzing historical data, machine learning models can identify which market conditions produce more reliable signals, allowing for dynamic adjustment of strategy aggressiveness. This approach can help the strategy adapt to different market environments.
-
Partial Profit Locking Mechanism - Introduce a tiered take profit mechanism that locks in partial profits when price reaches certain levels, while allowing the remaining position to continue tracking the trend. This approach can ensure some realized profit while maintaining the potential to capture larger trends.
Summary
The Trend Following Dual Indicator Confluence Automated Trading Strategy is a robust trend-following system that identifies strong trends and executes trades through the confluence of two major technical indicators: ADX and MACD. The key advantages of the strategy lie in its strict signal filtering mechanism, built-in risk management functions, and automated trading capabilities. While it faces inherent risks such as trend reversals and parameter sensitivity, these risks can be effectively managed through optimizations including dynamic parameter adjustment, volatility-adaptive stop losses, and multi-timeframe analysis. With the development of artificial intelligence and machine learning technologies, this strategy has enormous potential for further enhancement, potentially achieving more intelligent market adaptability in the future. For traders who prioritize risk management and seek to capture medium to long-term trends, this represents a worthwhile strategy framework.
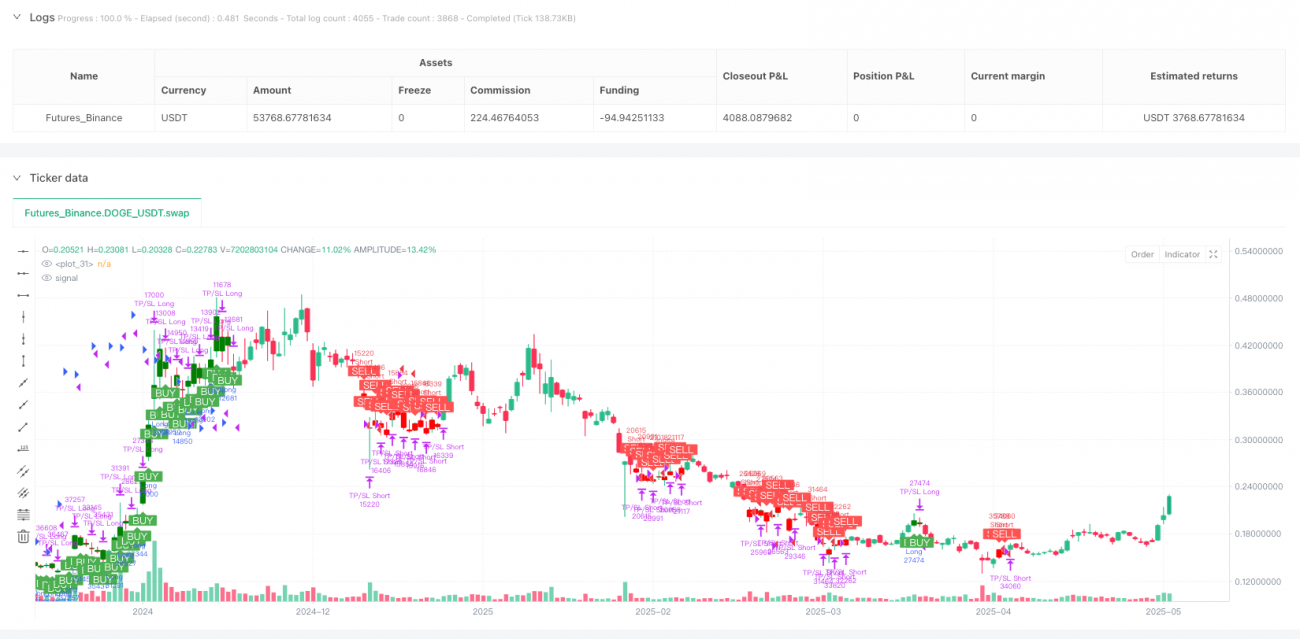
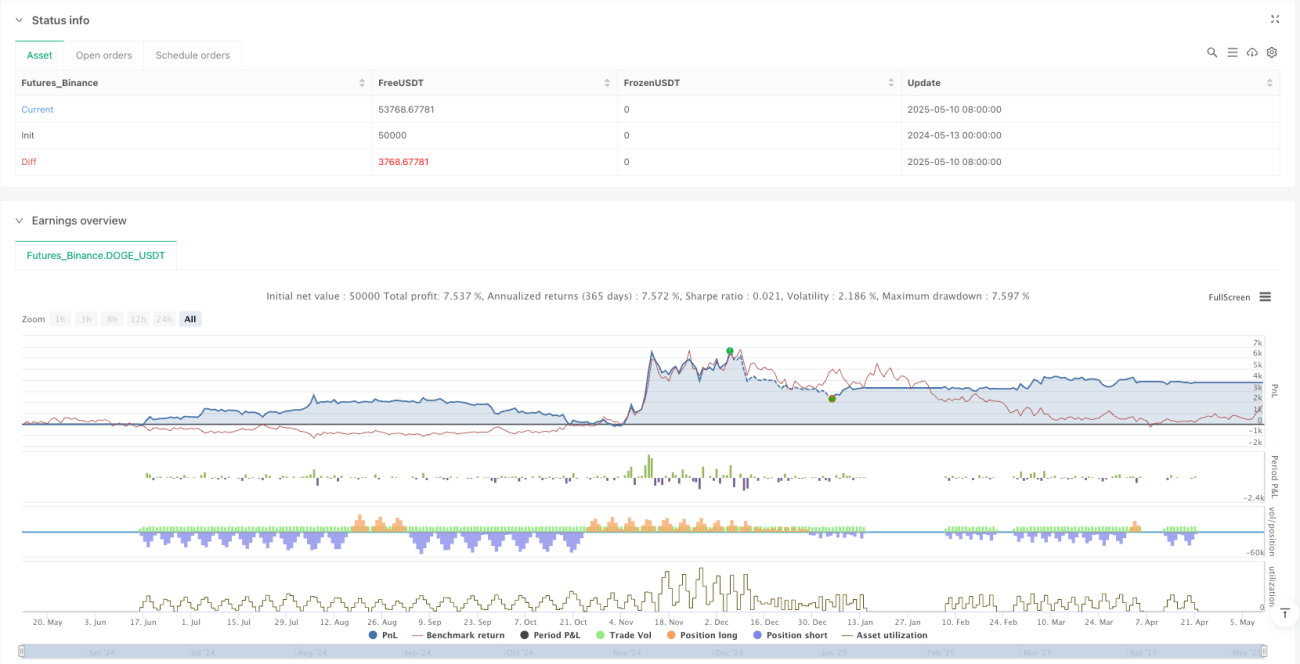
/*backtest
start: 2024-05-13 00:00:00
end: 2025-05-11 08:00:00
period: 1d
basePeriod: 1d
exchanges: [{"eid":"Futures_Binance","currency":"DOGE_USDT"}]
*/

//@version=5
strategy("TUE ADX/MACD Confluence Strategy V1.0", overlay=true, default_qty_type=strategy.percent_of_equity, default_qty_value=10)

// Input parameters- 1