
Strategy Overview
The Adaptive Market Regime RSI and Breakout Hybrid Quantitative Trading Strategy is a highly flexible quantitative trading system that automatically switches trading modes based on market conditions. The strategy uses the ADX indicator to identify whether the market is in a trending or ranging state, then applies different trading logic accordingly: in ranging markets, it implements mean reversion trading using the RSI indicator; in trending markets, it employs a breakout strategy aligned with the trend direction. Additionally, the strategy integrates a 200-day EMA as a trend direction filter and employs ATR dynamic trailing stops to protect profits and control drawdowns. This multidimensional design enables the strategy to maintain stable performance across different market environments, making it particularly suitable for volatile cryptocurrency markets like BTC, ETH, and SOL.
Strategy Principles
The core principle of this strategy is optimizing trading decisions through market state classification, with the following specific mechanisms:
-
Market State Identification: The strategy uses the ADX indicator to determine market conditions. When ADX exceeds the threshold (default 20), the market is classified as trending; when ADX falls below the threshold, the market is classified as ranging.
-
Trend Direction Identification: A 200-period EMA serves as the trend direction indicator. When price is above the EMA, the trend is bullish; when price is below the EMA, the trend is bearish.
-
Branching Trading Logic:
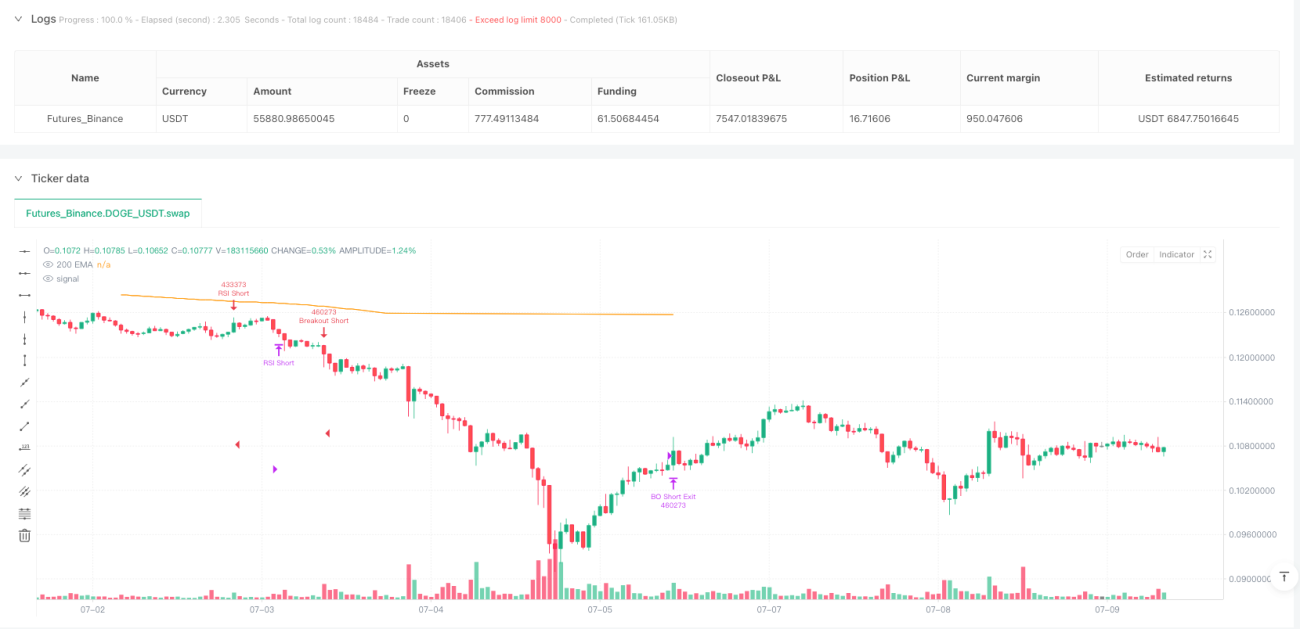
- In ranging markets (low ADX): Buy when RSI drops below 40 and price is above the 200 EMA; Sell when RSI rises above 60 and price is below the 200 EMA. Exit signals occur when RSI reverts to around the 50 level.
- In trending markets (high ADX): Buy when price breaks above the highest close of the previous 20 candles and price is above the 200 EMA; Sell when price breaks below the lowest close of the previous 20 candles and price is below the 200 EMA. Trailing stops set at a multiple of ATR protect profits.
-
Risk Management: The strategy implements an adaptive trailing stop mechanism set at 2x ATR, which dynamically adjusts with market volatility, both protecting profits and avoiding premature exits.
-
Trade Tracking: The system records the most recent trade type (RSI or breakout) and direction (long or short), facilitating backtesting analysis and real-time monitoring.
The elegance of this strategy lies in its ability to adapt rather than adhering to a single trading method, flexibly switching approaches based on market characteristics—seeking reversals in ranging markets and following momentum in trending markets.
Strategy Advantages
A deep analysis of the strategy's code implementation reveals the following significant advantages:
-
Strong Market Adaptability: By automatically identifying market conditions through the ADX indicator and switching trading logic accordingly, the strategy can adapt to different market environments, reducing inappropriate trading signals.
-
Multiple Confirmation Mechanisms: The strategy integrates multiple technical indicators (ADX, RSI, EMA, breakouts), forming a multi-layered filtering system that reduces the risk of false signals.
-
Trend Direction Consistency: The strategy only trades in the direction consistent with the main trend (200 EMA), avoiding the high risks associated with counter-trend trading.
-
Dynamic Risk Management: Using ATR-based trailing stops, the strategy automatically adjusts stop distances based on market volatility, protecting profits while giving price sufficient room to fluctuate.
-
Clear Visual Feedback: The strategy includes a dashboard label showing real-time market conditions and trade types, allowing traders to intuitively understand the current market situation and strategy status.
-
Time Filtering Capability: Built-in time filter allows the strategy to operate only during specific time periods, avoiding backtesting bias caused by insufficient historical data.
-
Flexible Capital Management: The strategy defaults to using account equity percentage for position management, facilitating automatic trade size adjustment based on capital scale.
-
Modular Code Design: The strategy code has a clear structure with independent functional modules, facilitating subsequent maintenance and optimization.
Strategy Risks
Despite its comprehensive design, the strategy still presents the following potential risks and limitations:
-
Market State Misjudgment Risk: The ADX indicator may delay in identifying changes in market conditions in certain scenarios, causing the strategy to use inappropriate trading logic. Consider adding other market state indicators as auxiliary confirmation to address this.
-
Parameter Sensitivity: The strategy includes multiple adjustable parameters (e.g., ADX threshold, RSI threshold, breakout period), with different parameter combinations potentially leading to significantly different performance. Comprehensive parameter optimization and stability testing are recommended.
-
False Breakout Risk: In highly volatile markets, price breakouts may quickly fail and retrace, leading to false signals. Consider adding volume confirmation or waiting for breakout confirmation to reduce false breakout risks.
-
Trend Filter Lag: The 200-period EMA responds slowly and may delay changes at trend turning points. Consider combining short and medium-term moving averages to form a moving average system for improved sensitivity to trend changes.
-
Lack of Volume Confirmation: The current strategy is primarily based on price indicators without volume analysis, potentially reducing effectiveness in certain market conditions. Adding volume indicators for signal confirmation is recommended.
-
Limited Drawdown Control: Although the strategy uses trailing stops, actual slippage in severe market fluctuations may limit stop-loss effectiveness. Consider adding fixed stop-losses as a safeguard.
-
Overtrading Risk: In highly volatile markets without clear direction, the strategy may generate excessive trading signals, increasing transaction costs. Consider adding signal filtering mechanisms to reduce low-quality trades.
Strategy Optimization Directions
Based on in-depth code analysis, here are potential optimization directions:
-
Dynamic Parameter Adaptation: Consider automatically adjusting RSI and breakout thresholds based on market volatility or other market characteristics to enhance strategy adaptability across different market environments.
-
Multi-Timeframe Analysis: Introduce confirmation signals from longer and shorter timeframes, such as using daily trends to confirm hourly trading signals, improving signal quality.
-
Volume Confirmation Mechanism: Add volume change confirmation to trading signals, especially for breakout trades, to filter out weak breakout signals with low volume.
-
Machine Learning Optimization: Consider using machine learning algorithms to dynamically identify optimal market states and parameter selection, further enhancing strategy adaptability.
-
Improved Market State Identification: Expand the single ADX indicator into a comprehensive market state assessment system combining volatility, trend strength, price structure, and other multi-dimensional indicators for more accurate market state identification.
-
Smarter Position Management: Dynamically adjust position size based on signal strength, market volatility, and trend strength—increasing positions on high-confidence signals and reducing positions in uncertain markets.
-
Diversified Strategy Portfolio: Use this strategy as part of a larger strategy portfolio, combining with other low-correlation strategies to improve overall risk-adjusted returns.
-
Entry and Exit Optimization: Implement more complex entry methods, such as scaled position building, and more comprehensive exit strategies, such as profit targets and time-based exits, creating a multi-dimensional exit system.
These optimization directions aim to further enhance the strategy's robustness, adaptability, and risk-adjusted returns, enabling it to maintain stable performance across a wider range of market conditions.
Conclusion
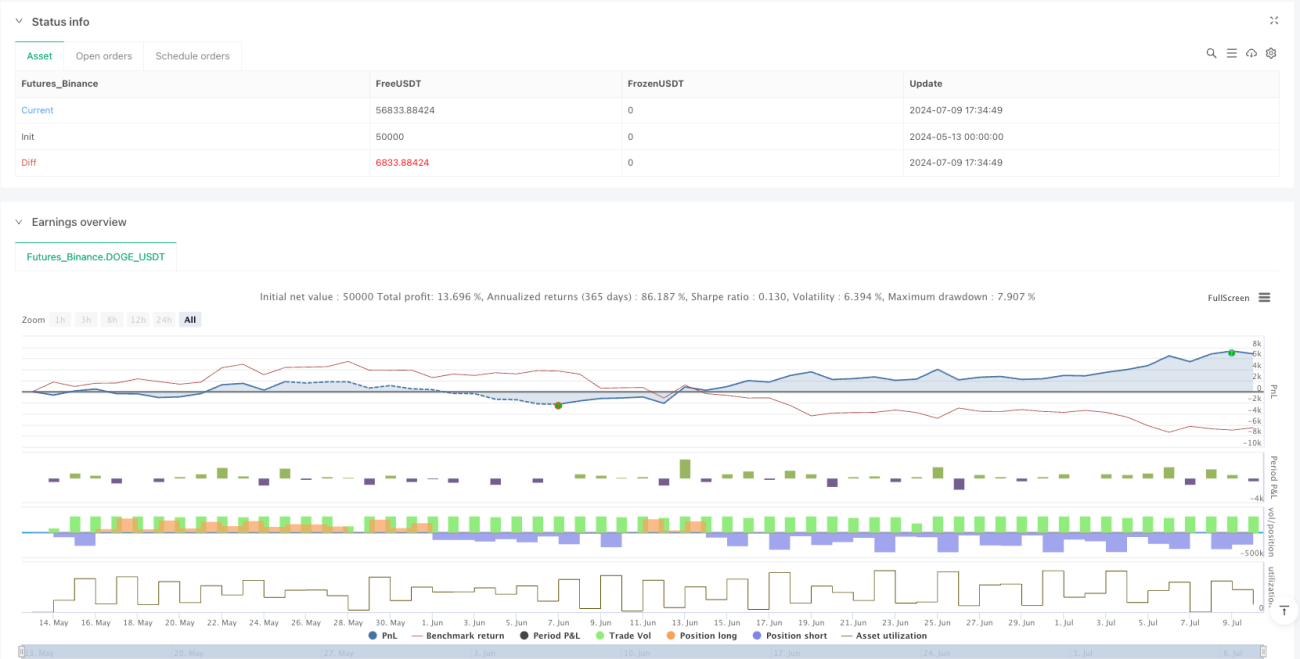
The Adaptive Market Regime RSI and Breakout Hybrid Quantitative Trading Strategy is an ingeniously designed trading system that effectively combines the advantages of mean reversion and trend following through its market state adaptation mechanism. By identifying market conditions with the ADX indicator, it captures oversold/overbought reversal opportunities using RSI in ranging markets and tracks momentum through price breakouts in trending markets, always ensuring trade direction aligns with the main trend using the 200 EMA filter.
The strategy's dynamic risk management system uses ATR trailing stops that automatically adjust protection levels based on market volatility, both securing profits and avoiding premature exits. Furthermore, the strategy's dashboard functionality provides clear market state and trading information feedback, enhancing usability and transparency.
Despite potential risks such as parameter sensitivity and market state misjudgment, through the suggested optimization directions like dynamic parameter adaptation, multi-timeframe analysis, and machine learning optimization, the strategy's robustness and adaptability can be further enhanced. Overall, this is a quantitative trading strategy with solid theoretical foundations, clear implementation logic, and good risk management mechanisms, particularly suitable for application in highly volatile markets such as cryptocurrencies.
- 1