
Overview
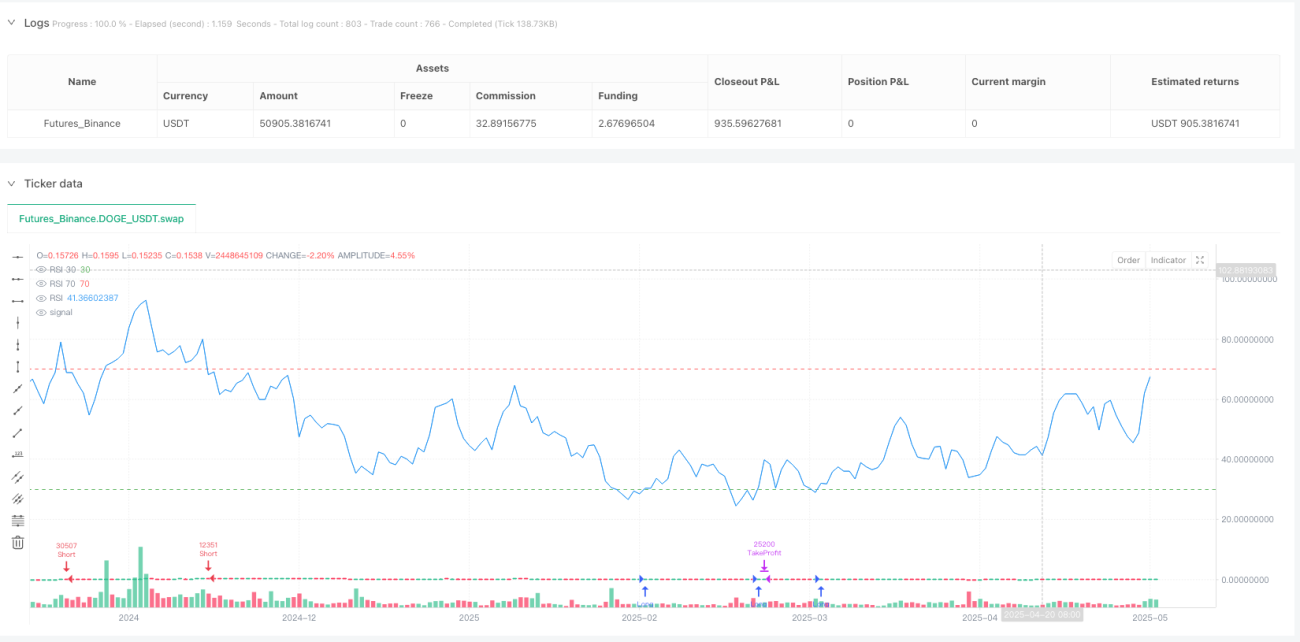
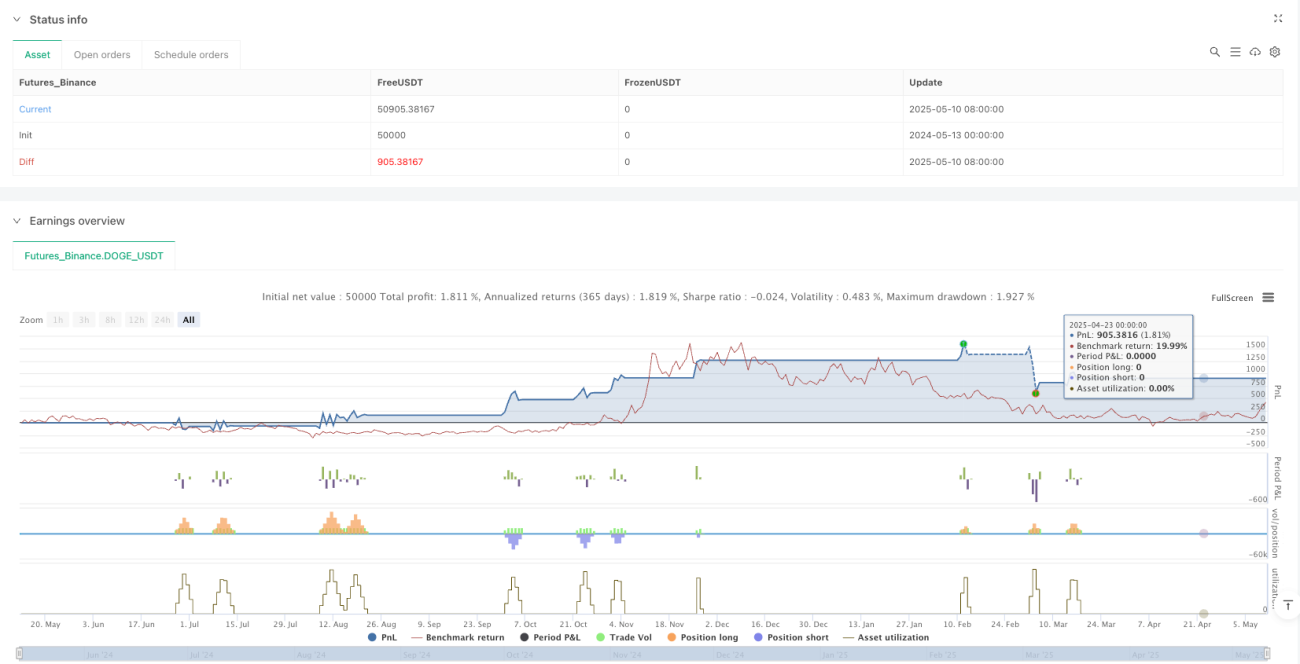
The RSI Dynamic Profit-Taking and Stop-Loss Tracking Strategy is a quantitative trading system based on the Relative Strength Index (RSI). This strategy utilizes the overbought and oversold regions of the RSI indicator for signal generation, combined with a comprehensive risk management mechanism that includes fixed stop-losses, dynamic trailing stops, and optimized risk-reward ratios. The strategy generates buy signals when RSI falls below 30 and sell signals when RSI rises above 70, while each trade is equipped with appropriate profit targets and stop-loss levels to protect capital and maximize profit potential.
Strategy Principles
The core of this strategy is using the RSI indicator to identify potential market reversal points and executing trades through precise entry and exit rules. The specific principles are as follows:
- Uses an RSI indicator with a length of 14 to calculate price relative strength
- When RSI crosses above the 30 level (using the ta.crossover function), a long signal is triggered
- When RSI crosses below the 70 level (using the ta.crossunder function), a short signal is triggered
- For each trade entry, risk management parameters are automatically set:
- Stop-loss is set at 1% from entry price (stopLossRatio = 0.01)
- Take-profit is set at 2% from entry price (2 * stopLossRatio)
- Trailing stop points are set at 0.5% of entry price (trailStopRatio = 0.005)
- Breakeven trigger is activated when price moves 0.5% in the favorable direction (breakevenTrigger = 0.005)
The strategy uses TradingView's strategy.entry and strategy.exit functions to execute trades, defaulting to 10% of account equity for each trade (default_qty_value=10). For long trades, the stop-loss price is close * (1 - 0.01) and take-profit price is close * (1 + 0.02); for short trades, the stop-loss price is close * (1 + 0.01) and take-profit price is close * (1 - 0.02).
Strategy Advantages
Analyzing the code of this quantitative strategy, we can summarize the following significant advantages:
- Clear Signal Generation Mechanism: Based on RSI indicator crossover events that produce definitive entry signals, avoiding subjective judgment
- Comprehensive Risk Management: Each trade has stop-loss and take-profit settings, making risk controllable, and uses a 1:2 risk-reward ratio that is favorable for long-term capital growth
- Dynamic Trailing Stop-Loss: Uses trail_points and trail_offset parameters to implement trailing stop functionality, allowing for greater profit retention in trending markets
- Automated Trade Execution: Once parameters are set, the strategy can run fully automatically, reducing emotional interference
- Clear Strategy Logic: The code structure is explicit, with functional modules reasonably divided, making it easy to understand and optimize
- Visual Feedback: By displaying RSI values and key level lines on the chart, traders can intuitively understand the strategy's operation
These advantages make the strategy particularly suitable for medium to long-term investors and traders who wish to reduce emotional influences on trading.
Strategy Risks
Despite its many advantages, the strategy still has the following risks that need attention:
- Repeated Oscillation Risk: In range-bound markets, RSI may frequently fluctuate between 30 and 70, leading to consecutive false signals and losing trades
- Fixed Parameter Limitations: The strategy uses fixed RSI length (14) and level lines (30/70), which may not be suitable for all market environments and timeframes
- Fixed Stop-Loss Ratio: Using a fixed percentage (1%) stop-loss may lead to premature exits in more volatile markets
- Lack of Market Environment Filtering: The strategy does not have mechanisms to adjust parameters or pause trading based on different market environments (trending/ranging)
- Transaction Costs Not Considered: The code does not explicitly handle slippage, commissions, and other trading costs, which may affect actual returns
- Event Risk: During major news or black swan events, prices may gap beyond stop-loss levels, resulting in actual losses greater than anticipated
To mitigate these risks, it is recommended to conduct thorough historical backtesting, adjust parameters to suit specific market conditions, and consider adding additional filters to reduce false signals.
Strategy Optimization Directions
Based on in-depth analysis of the code, the strategy can be optimized in the following directions:
- Add Trend Filters: Combine moving averages or ADX indicators to trade only in clear trend directions, avoiding frequent trading in oscillating markets
- Dynamic RSI Parameters: Automatically adjust RSI length and overbought/oversold levels based on market volatility, such as expanding the 30/70 range when volatility increases
- Improve Stop-Loss Mechanism: Use ATR (Average True Range) to set stop-loss positions instead of fixed percentages, making stops more aligned with actual market volatility
- Optimize Capital Management: Implement position sizing adjustments based on volatility, increasing positions in low volatility and reducing them in high volatility
- Add Time Filters: Avoid trading during market open, close, or low liquidity periods
- Signal Confirmation Mechanism: Add additional confirmation indicators, such as volume or other momentum indicators, to reduce false signals
- Optimize Risk-Reward Ratio: Test different take-profit and stop-loss ratios based on historical data to find the optimal combination
- Implement Breakout Strategy Combination: Execute trades only after confirming price breakouts of key support/resistance levels when RSI signals appear
Implementation of these optimization directions requires more code logic and parameter testing but can significantly enhance the strategy's robustness and profitability.
Conclusion
The RSI Dynamic Profit-Taking and Stop-Loss Tracking Strategy is a well-designed quantitative trading system that combines classical RSI indicator signal generation with modern risk management techniques. The core advantages of the strategy lie in its clear trading rules and comprehensive risk control mechanisms, including fixed stop-losses, dynamic trailing stops, and optimized risk-reward ratios.
However, the strategy also has some limitations, such as the tendency to generate false signals in oscillating markets and the lack of flexibility due to fixed parameters. By adding trend filters, introducing dynamic parameter adjustments, improving stop-loss mechanisms, and optimizing capital management, the strategy's performance can be further enhanced.
This strategy is suitable as a basic framework for trading systems. Traders can make personalized adjustments to parameters based on their trading style and market observations, or combine it with other technical indicators to build more robust and adaptive trading systems. The ultimate goal is to capture market opportunities and achieve consistent, stable returns through systematic methods while ensuring capital protection.
- 1