
Overview
The Reverse Keltner Channel with ADX Trend Filtering Quantitative Trading Strategy is a mean-reversion trading system that cleverly utilizes price movements between Keltner Channels. Unlike traditional Keltner Channel breakout strategies, this approach takes a contrarian perspective, entering positions when price returns to the channel boundaries from extreme positions. Its innovation lies in incorporating the ADX (Average Directional Index) as a trend strength filter, enabling the strategy to more effectively capture mean-reversion opportunities in weak trend market environments.
Strategy Principles
The core logic of this strategy is based on the interaction between price and Keltner Channels, along with trend strength information provided by the ADX indicator:
-
Keltner Channel Construction:
- Uses Exponential Moving Average (EMA) as the center line
- Channel width is determined by Average True Range (ATR) multiplied by a factor
- Upper Band = EMA + ATR Multiplier × ATR
- Lower Band = EMA - ATR Multiplier × ATR
-
ADX Trend Filtering:
- Calculates ADX value to judge market trend strength
- When ADX is below threshold, market is considered weakly trending or ranging, suitable for mean-reversion strategies
-
Long Entry Conditions:
- Price crosses above the lower Keltner Channel from below
- ADX indicator is below the set threshold (default 25), indicating a weak trend state
- Entry price is the market price at signal confirmation
-
Long Exit Conditions:
- Take Profit: Price reaches the upper Keltner Channel
- Stop Loss: Placed below entry price at a distance of half the channel width
-
Short Entry Conditions:
- Price crosses below the upper Keltner Channel from above
- ADX indicator is below the set threshold, indicating a weak trend state
- Entry price is the market price at signal confirmation
-
Short Exit Conditions:
- Take Profit: Price reaches the lower Keltner Channel
- Stop Loss: Placed above entry price at a distance of half the channel width
The strategy implementation flexibly utilizes ta.crossover and ta.crossunder functions to capture price crossings with channel boundaries, and determines entry timing through conditional judgment combined with the ADX filter, fully demonstrating the precision and systematic nature of quantitative trading.
Strategy Advantages
-
Robust Mean-Reversion Logic: The strategy is built on the market characteristic that prices tend to revert to the mean, especially suitable for range-bound markets, providing reliable trading signals.
-
Intelligent Trend Strength Filtering: Effectively identifies market conditions through the ADX indicator, avoiding mean-reversion trades in strong trend environments, significantly improving the strategy's success rate.
-
Dynamic Risk Management: Stop loss levels automatically adjust based on current market volatility (ATR), ensuring risk maintains a reasonable proportion to potential reward regardless of changing market conditions.
-
Visualized Trading Signals: Clearly indicates entry points with triangular markers and directional arrows, making strategy execution more intuitive and straightforward.
-
High Customizability: All key parameters can be adjusted, including EMA length, ATR multiplier, ADX threshold, and stop loss factor, facilitating adaptation to different trading instruments and timeframes.
-
Bi-directional Trading Opportunities: Captures both long and short opportunities, maximizing market participation and balancing trading outcomes.
Strategy Risks
-
Trend Continuation Risk: Despite using the ADX filter, there remains the possibility that markets continue to run after a breakout rather than reverting, causing the mean-reversion assumption to fail. Mitigation method: Consider adding trend confirmation indicators or optimizing ADX threshold settings.
-
Parameter Sensitivity: Strategy performance is highly sensitive to Keltner Channel parameters (EMA length, ATR multiplier) and ADX settings. Improper parameter selection may lead to overtrading or missed opportunities. Solution: Conduct comprehensive backtesting based on specific trading instruments and timeframes to find optimal parameter combinations.
-
False Breakout Risk: Markets may produce temporary false breakout signals, triggering unnecessary trades. Countermeasure: Consider adding confirmation elements, such as requiring price to remain outside the channel for a minimum time or incorporating other indicators for confirmation.
-
Inadequate Adaptation to Volatility Changes: Extreme market events may cause sudden volatility changes, temporarily invalidating channel width settings based on historical ATR. Improvement approach: Introduce volatility warning mechanisms or adaptive channel width algorithms.
-
Market Environment Dependency: This strategy performs best in weak trend or range-bound markets and may suffer sustained losses in continuous one-directional trend environments. Risk control: Implement overall risk limits or pause the strategy when strong trend environments are identified.
Strategy Optimization Directions
-
Multiple Timeframe Analysis: Incorporate higher timeframe trend direction into the decision-making process, only trading in the direction of the main trend, or adjusting position size based on higher timeframe trends. This can improve strategy alignment with overall market structure and reduce counter-trend trading.
-
Dynamic ADX Threshold: The current strategy uses a fixed ADX threshold (default 25) to distinguish between strong and weak trends. Consider implementing an adaptive threshold that adjusts based on historical ADX distribution characteristics or volatility to adapt to different market phases.
-
Entry Optimization: Introduce price momentum confirmation mechanisms, requiring not only channel boundary crossings but also momentum in the expected direction, such as combining with RSI indicators or candlestick patterns for confirmation.
-
Exit Strategy Enhancement: The current strategy uses fixed take profit (opposite channel boundary) and stop loss (half channel width). Consider implementing dynamic profit targets or trailing stops to maximize gains in favorable market conditions.
-
Volatility Adjustment Mechanism: Add market volatility monitoring logic to automatically adjust parameters or pause trading during abnormal volatility periods (such as economic announcements or market turmoil), reducing black swan event risk.
-
Time Filter: Introduce trading time filters to avoid low volatility or unpredictable market sessions (such as Asian lunch hours or before/after market openings), focusing on high-quality trading time windows.
-
Machine Learning Optimization: Utilize machine learning algorithms to dynamically evaluate market conditions and predict strategy performance probability in the current environment, adjusting parameters or trading size accordingly.
Summary
The Reverse Keltner Channel with ADX Trend Filtering Quantitative Trading Strategy is a carefully designed mean-reversion system that captures price reversion opportunities in oscillating markets by combining Keltner Channel boundary breakout signals with ADX trend strength filtering. Its dynamically adjustable risk management mechanism and highly customizable parameter settings enable it to adapt to various trading instruments and market environments.
The strategy's main innovation lies in applying the traditional Keltner Channel trading approach in reverse and intelligently filtering market conditions through the ADX indicator, effectively avoiding unfavorable mean-reversion trades in strong trend environments. Through the optimization directions proposed in this article, especially multiple timeframe analysis and dynamic parameter adjustment, this strategy has the potential to further enhance its adaptability and stability.
For quantitative traders, this strategy provides a clearly structured, logically sound trading framework while leaving ample room for customization and optimization. Before live application, it is recommended to conduct comprehensive backtesting and fine-tune parameters based on market experience to achieve the optimal risk-reward ratio.
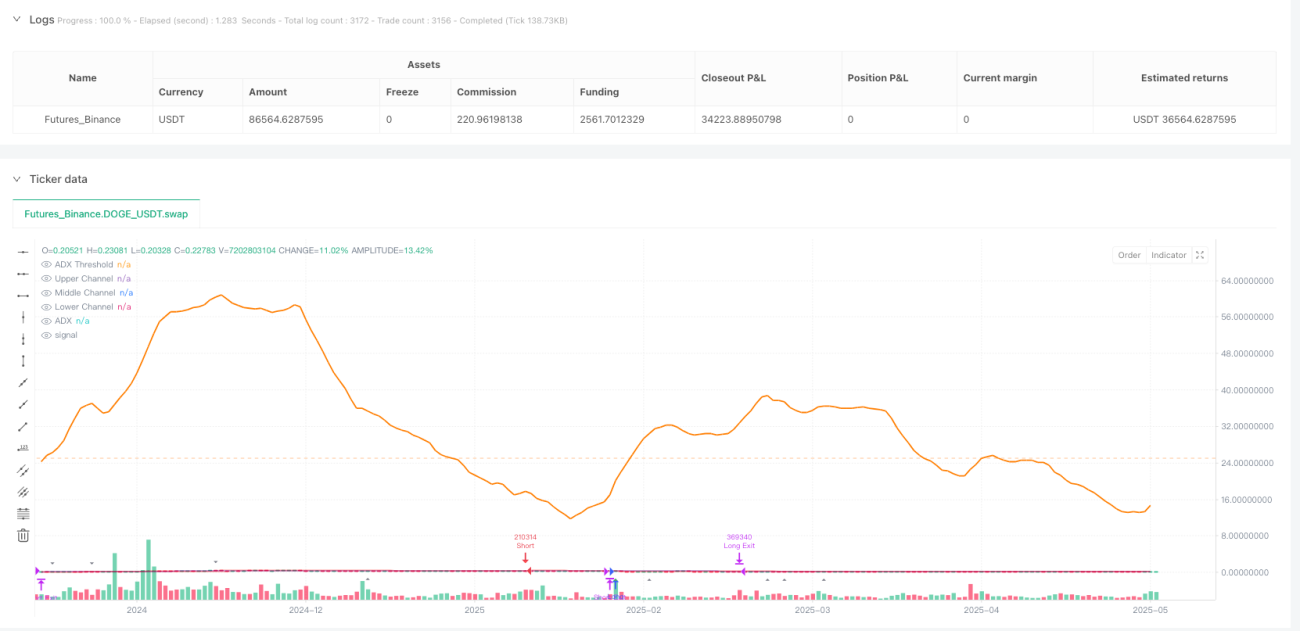
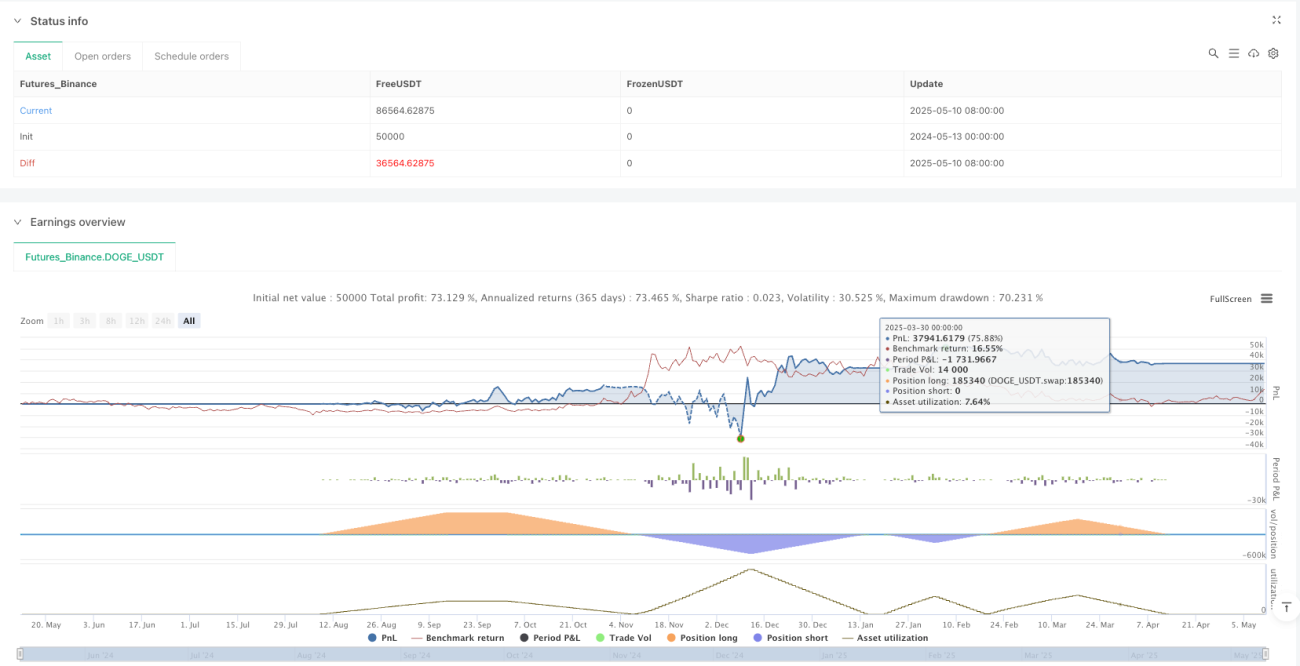
/*backtest
start: 2024-05-13 00:00:00
end: 2025-05-11 08:00:00
period: 1d
basePeriod: 1d
exchanges: [{"eid":"Futures_Binance","currency":"DOGE_USDT"}]
*/

// Reverse Keltner Channel Strategy with ADX Filter
// @fenyesk
// Description: Enters long when price crosses lower Keltner channel from below
// and exits when price crosses upper Keltner channel.- 1