
Overview
This strategy is an advanced adaptive trading system that automatically switches between trading modes based on market structure recognition techniques. The strategy utilizes the ADX indicator to determine market conditions, employing an RSI mean-reversion strategy in ranging markets (ADX ≤ 25) and a price breakout strategy in trending markets (ADX > 25). The system first checks a 200-period EMA trend filter to ensure alignment with the major trend direction, while implementing an ATR-based risk management system to set appropriate stop-losses for trades in different market environments. The system is optimized for BTC/USDT on H1/H4 timeframes and improves overall profitability and stability by dynamically adapting to different market conditions.
Strategy Principles
The core of this strategy is a market structure adaptive mechanism that operates through the following key steps:
-
Market State Recognition: Uses ADX (Average Directional Index) to determine whether the market is in a ranging or trending state. ADX > 25 indicates a trending market, while ADX ≤ 25 indicates a ranging market.
-
Trend Direction Filtering: Uses a 200-period EMA as a trend direction filter. Price above EMA is considered bullish, while price below EMA is considered bearish.
-
Ranging Market Strategy:
- When the market is ranging and RSI < 35 (oversold) and in a bullish trend, execute a long position
- When the market is ranging and RSI > 70 (overbought) and in a bearish trend, execute a short position
- Close RSI trades when RSI reverts to the 50 level
- Use 1.2x ATR as a stop-loss for RSI trades
-
Trending Market Strategy:
- When the market is strongly trending and in a bullish trend, execute a long position if price breaks above the 20-period high
- When the market is strongly trending and in a bearish trend, execute a short position if price breaks below the 20-period low
- Use a 1.5x ATR trailing stop to protect profits on trend trades
-
Risk Management: Each trade risks 10% of account equity, with different stop-loss strategies based on the type of trade.
The strategy uses a time filter to only trade after January 1, 2020, ensuring it operates during more mature phases of the cryptocurrency market.
Strategy Advantages
-
Market Adaptability: The strategy's greatest advantage is its ability to automatically switch trading modes based on market conditions, using mean-reversion in ranging markets and breakout techniques in trending markets, allowing it to remain competitive across various market environments.
-
Trend Alignment: Through the 200 EMA trend filter, the strategy ensures trade direction aligns with the major trend, avoiding the high risks associated with counter-trend trading.
-
Tailored Risk Control: The strategy employs different risk management methods for different types of trades, using fixed ATR multiplier stops for RSI trades and trailing stops for breakout trades, optimizing the risk/reward characteristics for each trading mode.
-
Real-time Market Feedback: Through the built-in dashboard, traders can monitor market state, trend bias, and recent trade signals in real-time, facilitating quick decision-making and strategy adjustments.
-
Parameter Adjustability: The strategy provides multiple customizable parameters, including RSI thresholds, ADX length and threshold, breakout lookback period, etc., allowing traders to optimize based on their risk preferences and market views.
Strategy Risks
-
Parameter Sensitivity: Strategy performance is highly dependent on the chosen parameters, such as ADX threshold and RSI levels. Poor parameter selection may lead to frequent market mode switching or incorrect trading signals, increasing unnecessary trading costs and potential losses. The solution is to conduct rigorous backtesting on historical data and select robust parameters suitable for current market conditions.
-
False Breakout Risk: In trend mode, the strategy is susceptible to false breakouts, especially in highly volatile markets. These false signals may lead to stop-losses being triggered, reducing overall profitability. It is recommended to add additional confirmation indicators or set more conservative breakout conditions to reduce such risks.
-
Overtrading Risk: Overly sensitive RSI settings in ranging markets may lead to overtrading, increasing commission costs and potentially missing larger price movements. The solution is to adjust RSI thresholds or add additional trade filters to reduce trading frequency.
-
Fixed Percentage Risk: The strategy uses a fixed 10% of equity as risk for each trade, which may lead to significant account drawdowns in cases of consecutive losses. Implementing a dynamic position sizing mechanism is recommended, adjusting risk exposure based on recent trading performance or market volatility.
-
Market State Misidentification: The ADX indicator may inaccurately reflect market state under certain market conditions, causing the strategy to select the wrong trading mode. It is advisable to combine other market structure indicators to enhance the accuracy of state determination.
Strategy Optimization Directions
-
Multi-timeframe Analysis Integration: The strategy can be enhanced by incorporating multi-timeframe analysis for trading decisions, such as using higher timeframe trend direction to filter lower timeframe trading signals, improving overall success rates. Specific implementation could add H4 or daily trend filters to guide H1 trades.
-
Dynamic Parameter Optimization: Currently, the strategy uses fixed parameters, which could be improved to automatically adjust key parameters based on market volatility or recent price behavior. For example, RSI thresholds could be adjusted according to market volatility, using narrower RSI ranges in low-volatility environments and wider ranges in high-volatility environments.
-
Advanced Entry Confirmation: Add additional technical indicators as trade confirmations, such as volume analysis, candlestick pattern recognition, or market sentiment indicators. This can reduce false signals and improve entry quality.
-
More Sophisticated Risk Management: Implement dynamic position management and adaptive stop-loss strategies, adjusting trade size and stop levels based on market volatility, recent profits/losses, or drawdown depth.
-
Machine Learning Optimization: Use machine learning algorithms to dynamically predict optimal market state thresholds (such as ADX switching points) or identify which trading mode is likely to perform better under specific market conditions, thereby improving strategy adaptability and performance.
Summary
The Dual-Regime Adaptive Trading System creates a comprehensive trading system capable of automatically adapting to different market conditions by combining RSI mean-reversion and price breakout strategies. The strategy's uniqueness lies in its use of the ADX indicator to categorize the market into ranging and trending states and applying the most appropriate trading method for each state. Through EMA trend filtering and ATR-based risk management, the strategy pursues consistent returns while maintaining trading safety. While there are some potential risks, such as parameter sensitivity and market state misidentification, these can be effectively mitigated through the suggested optimization directions, including multi-timeframe analysis, dynamic parameter adjustment, and advanced risk management. For traders seeking to maintain competitiveness across different market environments, this adaptive approach provides a powerful framework, especially when trading volatile assets like Bitcoin.
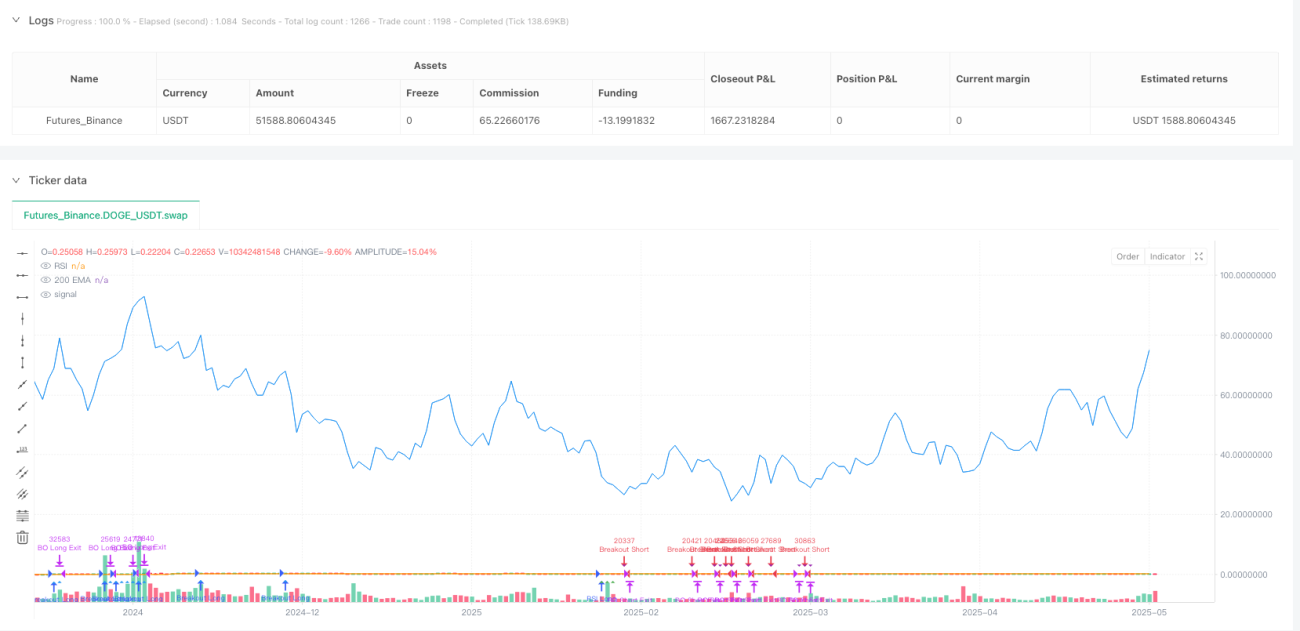
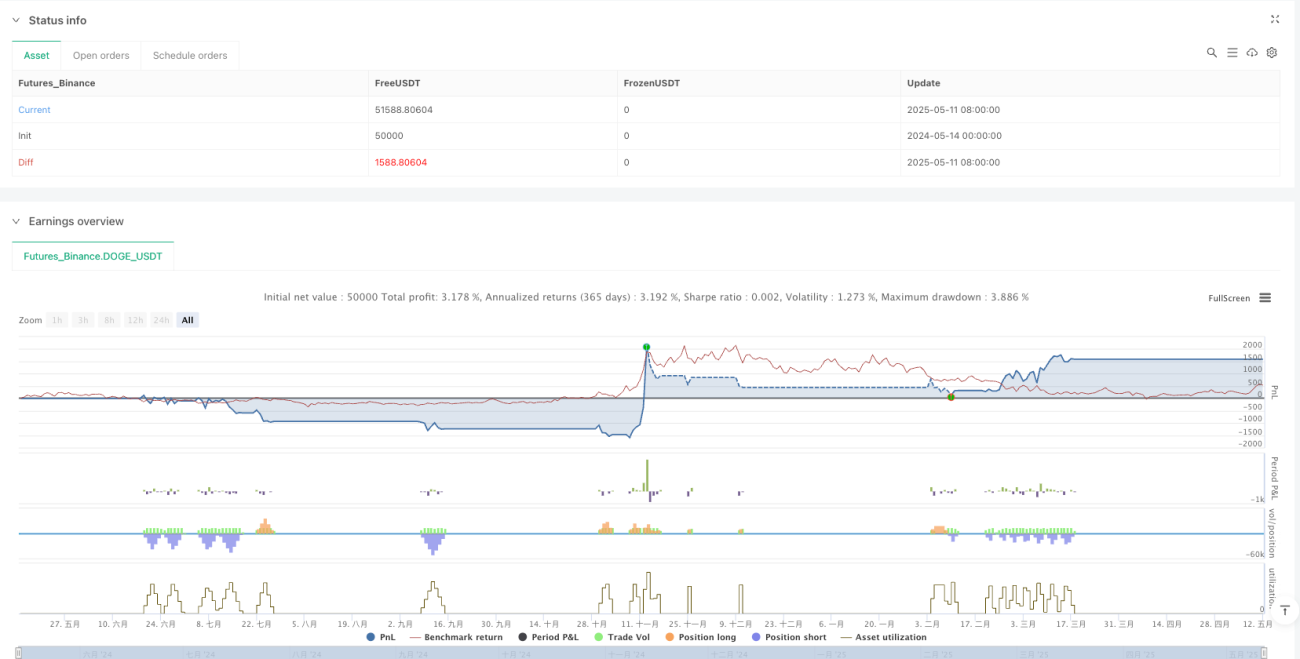
/*backtest
start: 2024-05-14 00:00:00
end: 2025-05-12 08:00:00
period: 1d
basePeriod: 1d
exchanges: [{"eid":"Futures_Binance","currency":"DOGE_USDT"}]
*/

//@version=6
strategy("Improved Hybrid: RSI + Breakout + Dashboard", overlay=true, default_qty_type=strategy.percent_of_equity, default_qty_value=10)

// === INPUTS ===- 1