Pivotal Liquidity Swing Momentum Strategy with Dynamic Risk-Reward Optimization

Overview
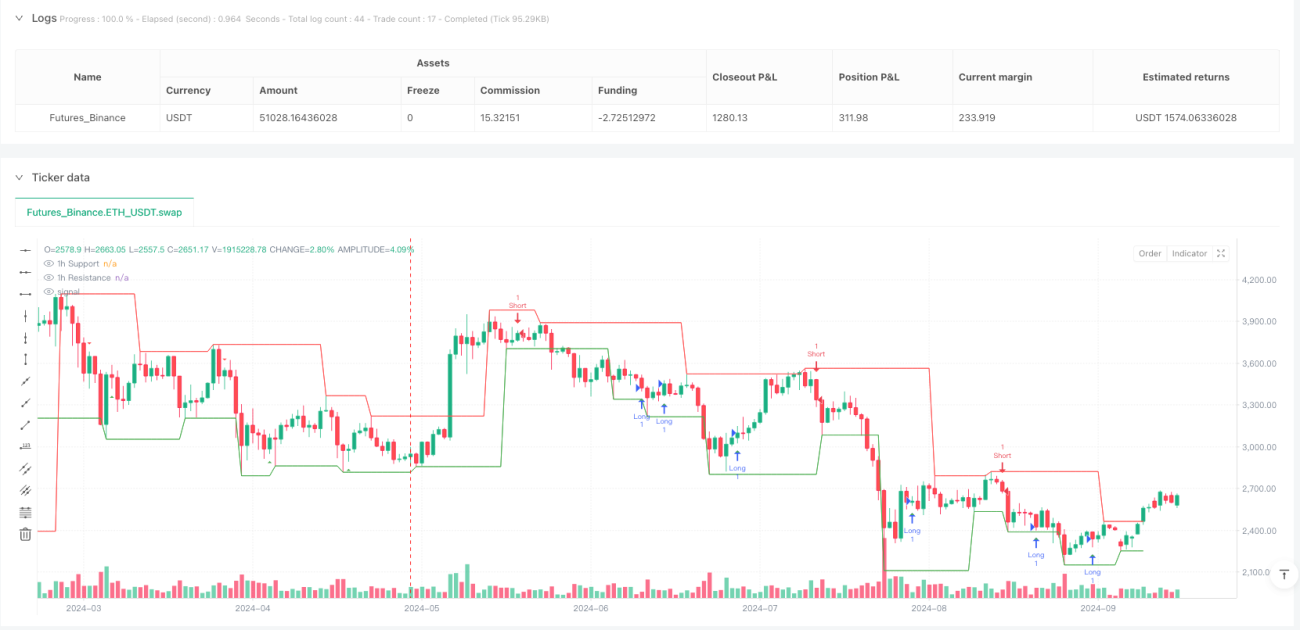
The Pivotal Liquidity Swing Momentum Strategy is a quantitative trading system based on technical analysis that leverages key support and resistance areas (liquidity zones) for trading decisions. The core of this strategy lies in identifying liquidity swing points on a 1-hour timeframe and entering the market when price breaks through these key levels, while applying a strict 1:2 risk-reward ratio for risk management. The strategy employs pivot point analysis techniques, calculating swing highs (resistance) and swing lows (support) through ta.pivothigh and ta.pivotlow functions, combined with trend direction filtering to achieve precise market entry timing.
Strategy Principles
The strategy operates based on the synergistic action of several key concepts:
-
Liquidity Zone Identification: The strategy uses ta.pivothigh and ta.pivotlow functions to identify key liquidity areas (support and resistance) in the market. The lookback parameter (default 5) controls the sensitivity of pivot points - smaller values increase sensitivity but may introduce noise, while larger values do the opposite.
-
Entry Logic:
- Long: Enter when price breaks above the 1-hour support level (ta.crossover(low, support1h)) in an uptrend and price is below recent resistance (close < resistance1h).
- Short: Enter when price breaks below the 1-hour resistance level (ta.crossunder(high, resistance1h)) in a downtrend and price is above recent support (close > support1h).
-
Risk Management:
- Initial Stop-Loss: For long positions, a buffer is set below support (support1h * (1 - stopLossBuffer / 100)), and for short positions, above resistance (resistance1h * (1 + stopLossBuffer / 100)).
- Breakout Stop-Loss: Triggered when price closes below support (close < support1h) for long positions, or above resistance (close > resistance1h) for short positions.
-
Profit Targets: The strategy employs a fixed 1:2 risk-reward ratio to calculate profit targets:
- Long: takeProfitPrice = entryPrice + 2 * risk
- Short: takeProfitPrice = entryPrice - 2 * risk
Through this approach, the strategy ensures that profitable trades generate enough return to offset losing trades while maintaining a high win rate.
Strategy Advantages
Through deep analysis of the strategy's code implementation, the following significant advantages can be identified:
-
Highly Objective Entry Points: Support and resistance levels identified using technical indicators (pivot points) provide objective entry signals, reducing emotional bias from subjective judgment.
-
Adaptive to Market Volatility: Since the strategy calculates key levels based on price movements, it automatically adapts to volatility changes in different market environments without requiring frequent parameter adjustments.
-
Clear Risk Management Framework: The fixed 1:2 risk-reward ratio and dynamic stop-loss strategy ensure consistency and effectiveness in money management. When the market moves against trade expectations, the system can cut losses promptly to protect account capital.
-
Trend Confirmation Filtering: The strategy requires specific price positions relative to support/resistance levels, which helps ensure trading signals align with the overall market trend, reducing the possibility of counter-trend trading.
-
Visual Analysis Assistance: The strategy provides visualization of support levels, resistance levels, and entry signals, helping traders intuitively understand market conditions and strategy decisions.
Strategy Risks
Despite its many advantages, the strategy also faces several potential risks:
-
False Breakout Risk: In highly volatile or low-liquidity markets, prices may frequently break through support/resistance levels only to revert, generating false breakout signals. Solution: Add confirmation conditions, such as waiting for a confirming close after breakout or adding volume filters.
-
Parameter Sensitivity: The choice of lookback parameter significantly impacts signal quality. Too small values produce excessive signals and noise, while too large values might miss important turning points. Solution: Optimize parameters based on the historical volatility of specific markets.
-
Stop-Loss Level Risk: Fixed percentage stop-loss buffers may not be flexible enough in different volatility environments. During high volatility periods, they might trigger stops too early; during low volatility, stop positions might be too distant. Solution: Implement volatility-adaptive stop-loss buffers.
-
Trading Cost Impact: The profit targets and stop-loss calculations do not consider trading fees, which in live trading may result in actual returns lower than expected. Solution: Incorporate trading costs into calculations.
-
Limitations of Historical Data Dependency: Pivot point calculations rely on historical data, meaning the strategy may react with a lag when market conditions change significantly. Solution: Enhance predictive capability by incorporating other forward-looking indicators.
Strategy Optimization Directions
Based on code analysis, the strategy can be optimized in the following directions:
-
Volatility-Adaptive Parameters: Introduce volatility indicators (such as ATR) to dynamically adjust lookback parameters and stop-loss buffers, enabling the strategy to better adapt to different market conditions. This approach recognizes that market volatility changes over time, and fixed parameters perform inconsistently across different volatility environments.
-
Add Volume Confirmation: Incorporate volume confirmation conditions into entry signals to reduce false breakout risk. High-volume breakouts are typically more reliable as they indicate stronger consensus among market participants.
-
Multi-Timeframe Analysis: Integrate trend analysis from longer timeframes (such as 4-hour or daily) to ensure trade direction aligns with larger trends. This helps improve signal quality, as trading with major trends typically has a higher success rate.
-
Dynamic Risk-Reward Ratio: Adjust risk-reward ratios based on market volatility or technical patterns (such as distance from key levels), increasing profit targets when opportunities are better. This maximizes returns when high-quality signals appear.
-
Machine Learning Enhancement: Use machine learning algorithms to analyze features of historical signals, predict the probability of signal success, and adjust position sizing or risk parameters accordingly. This helps the strategy learn patterns from historical data and improves predictive accuracy.
-
Add Profit Run Management: Implement trailing stops or partial profit functions, allowing profitable trades to capture larger market movements. This is particularly valuable for capturing trend-based movements and can significantly enhance the strategy's overall returns.
Summary
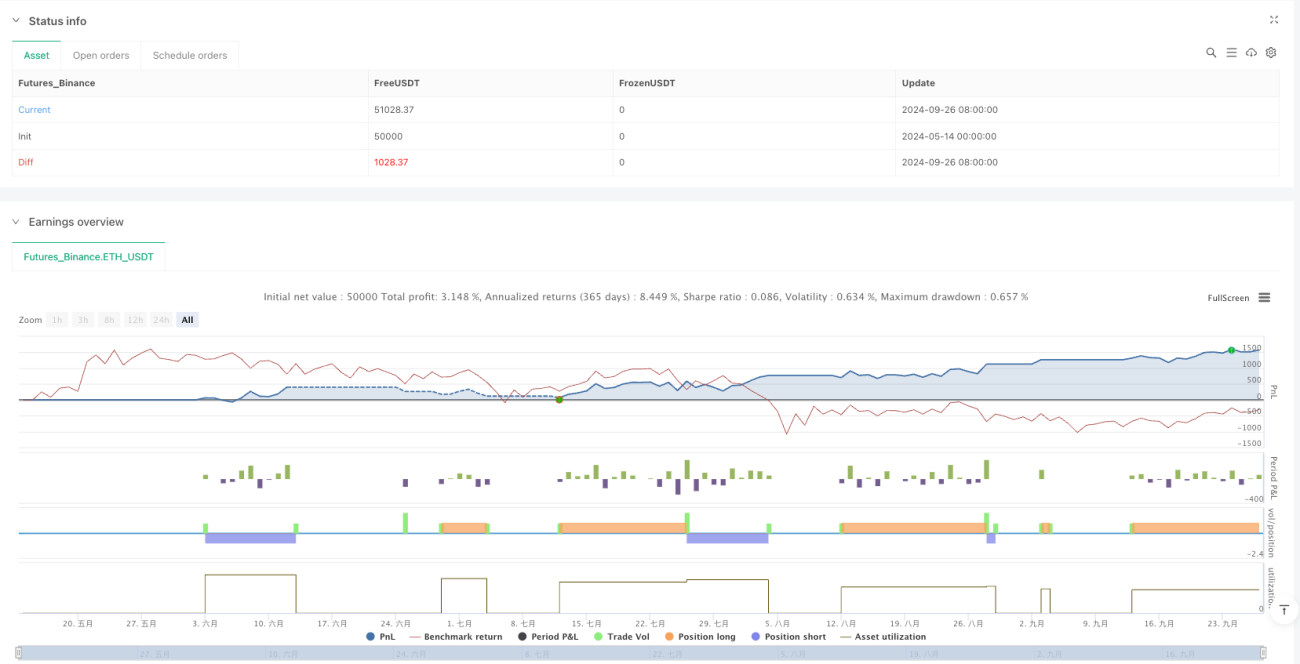
The Pivotal Liquidity Swing Momentum Strategy is a clearly structured, logically complete quantitative trading system that cleverly combines pivot point theory, price action analysis, and risk management principles from technical analysis. The core advantages of this strategy lie in its objective entry signals and strict risk control mechanisms, making it suitable for application in various market environments.
By identifying key liquidity areas (support and resistance) on the 1-hour timeframe, the strategy can capture momentum opportunities when price breaks through these areas. The fixed 1:2 risk-reward ratio ensures a positive mathematical expectation for long-term profitability, while the dynamic stop-loss mechanism provides an additional layer of risk protection.
Although the strategy faces challenges such as false breakouts and parameter optimization, these issues can be effectively mitigated through the optimization directions proposed in this article—such as volatility-adaptive parameters, volume confirmation, and multi-timeframe analysis. Particularly, introducing machine learning techniques could bring significant performance improvements to the strategy.
Overall, the Pivotal Liquidity Swing Momentum Strategy provides traders with a systematic, replicable trading method that reduces emotional bias and enhances discipline. For traders willing to deeply research and optimize, this strategy offers a solid foundation that can be customized according to individual risk preferences and target markets.
- 1