Dynamic Slope Dual-SMA Narrow-Band Breakout Quantitative Trading Strategy

Overview
The Dynamic Slope Dual-SMA Narrow-Band Breakout Quantitative Trading Strategy is an advanced trading system based on Oliver Velez's teaching principles, combining core elements of technical analysis and momentum trading. This strategy primarily utilizes the relationship between short-term (20-period) and long-term (200-period) Simple Moving Averages (SMA), along with price dynamics, volatility, and candlestick patterns to identify high-probability breakout opportunities in narrow-band regions. The core feature of this strategy is identifying strong directional "Elephant Bars" and color change signals within narrow-band areas where moving averages are closely related, while managing stop-loss and take-profit levels using preset risk-reward ratios.
Strategy Principles
The core principles of this strategy are based on the synergistic action of several key factors:
-
Dual Moving Average System: The strategy utilizes 20-period SMA and 200-period SMA to create a trading framework. When these two moving averages are relatively close (narrow-band state, less than 1.5% difference), the system looks for potential trading signals.
-
Moving Average Slope Validation: The strategy calculates the angle of the 20-period SMA (using the arctangent function) to ensure the market has sufficient momentum, only considering entry when the angle exceeds 30 degrees.
-
Entry Signal Types:
- Primary Entry Signal ("Elephant Bar"): This is a powerful price action signal requiring candle length to exceed 1.5 times ATR, with a high above the previous candle (for longs) or a low below the previous candle (for shorts).
- Secondary Entry Signal ("Color Change"): This is a supplementary signal triggered when candle color changes from red to green (for longs) or from green to red (for shorts).
-
Risk Management Framework:
- Stop-Loss Setting: For long trades, stop-loss is set at the recent low or 2 times ATR below entry price; for short trades, stop-loss is set at the recent high or 2 times ATR above entry price.
- Tiered Profit-Taking: Uses risk-reward ratios of 2.5R and 4.0R to set two target prices, moving the stop-loss to breakeven when the first target price is reached.
- Position Management: Uses 10% of account funds per trade, allowing a maximum of two additional positions (pyramid scaling).
-
Market State Assessment: The strategy assesses market state by calculating the relative distance between the two moving averages:
- Narrow-Band State: Moving average distance less than 1.5%, suitable for seeking breakout opportunities.
- Wide-Band State: Moving average distance greater than 2%, representing an established trend, not suitable for new entries.
Long entry conditions require: Narrow-band state + Valid slope + Closing price above SMA20 + SMA20 above SMA200 + Elephant Bar pattern.
Short entry conditions require: Narrow-band state + Valid slope + Closing price below SMA20 + SMA20 below SMA200 + Elephant Bar pattern.
Strategy Advantages
Through in-depth analysis of the code, this strategy has the following significant advantages:
-
Multiple Confirmation Mechanism: The strategy combines confirmation factors from multiple dimensions including moving average relationships, moving average slope, price position, and special candlestick patterns, effectively filtering out poor signals and improving trade quality.
-
Adaptation to Market States: By distinguishing between narrow-band and wide-band states, the strategy can seek opportunities in the most suitable market conditions, avoiding chasing highs or lows in already expanded trends.
-
Dynamic Risk Management: Using ATR as a volatility measurement tool ensures that stop-loss and profit targets can be dynamically adjusted based on current market volatility, rather than using fixed points.
-
Tiered Profit Strategy: Adopts a two-stage strategy of partial profit-taking and final profit-taking, which both secures partial profits in favorable market conditions and avoids exiting too early and missing major trends.
-
Intelligent Scaling Mechanism: Provides scaling opportunities through color change signals, allowing up to two additional positions in the same trend, optimizing capital efficiency.
-
Moving Stop-Loss Protection: Automatically moves stop-loss to breakeven when price reaches the first profit target, achieving "zero-risk" trading and protecting profits already gained.
-
Visual Assistance: The strategy provides clear visual indications and a dashboard, helping traders intuitively identify signals and market states, simplifying the decision-making process.
-
Combines Price Action with Technical Indicators: Integrates Oliver Velez's price action concepts with traditional technical indicators, creating a more robust trading system.
Strategy Risks
Despite its reasonable design, this strategy still has the following potential risks and challenges:
-
Parameter Sensitivity: Strategy performance largely depends on key parameter settings such as SMA periods, ATR length, and risk-reward ratios. Different markets and timeframes may require different parameter combinations, necessitating thorough historical backtesting and optimization.
-
False Breakout Risk: Breakouts in narrow-band areas can sometimes be false breakouts, especially in low-volatility market environments. Although the strategy uses "Elephant Bar" requirements to reduce false breakouts, they cannot be completely avoided.
-
Slippage and Execution Risk: In live trading, especially during high volatility, slippage issues may be encountered, causing actual entry prices to differ from ideal prices, affecting the overall risk-reward structure.
-
Money Management Challenges: Fixed use of 10% of funds and allowing two additional positions may lead to excessive risk during consecutive losses or extreme market volatility.
-
Overreliance on Moving Averages: The strategy primarily relies on SMAs to determine trend direction, but in ranging markets, moving averages may cross frequently, generating too many false signals.
-
Lack of Market Environment Filtering: The strategy does not adjust for different macro market environments (such as high or low volatility, bull or bear markets), potentially performing poorly in certain market phases.
-
Equity Curve Drawdown: As the strategy allows scaling in, sudden trend reversals may cause significant account drawdowns, especially when the market reverses after two additional positions.
Solutions include: adding additional market environment filters, adjusting money management proportions, dynamically adjusting parameters based on different market conditions, and considering adding other technical indicators to confirm signals.
Strategy Optimization Directions
Based on code analysis, this strategy can be optimized in the following directions:
-
Dynamic Narrow-Band Threshold: The current strategy uses fixed 1.5% and 2% as thresholds for narrow-band and wide-band judgment. Consider dynamically adjusting these thresholds based on historical volatility to better adapt to different market environments. Optimization reason: Different markets and timeframes have different volatility characteristics, and fixed thresholds may not be flexible enough.
-
Enhanced Moving Average System: Consider adding a medium-term moving average (such as 50-period SMA) to form a triple moving average system, or try Exponential Moving Averages (EMA) instead of SMA to increase sensitivity to price changes. Optimization reason: Adding a medium-term reference point can provide a more comprehensive market perspective, while EMA responds more sensitively to recent price changes.
-
Improved Slope Calculation: The current slope calculation is relatively simple; consider using linear regression slope or multi-period slope changes for more stable directional indication. Optimization reason: Single-point slope calculation is easily affected by short-term fluctuations; improvements can enhance direction judgment stability.
-
Add Volume Confirmation: Add volume conditions to entry signals, such as requiring "Elephant Bars" to be accompanied by above-average volume breakouts. Optimization reason: Volume is an important confirmation factor for price movement validity and can significantly reduce false breakouts.
-
Dynamic Risk-Reward Ratio: Dynamically adjust risk-reward ratios based on market volatility or ATR percentage, using higher RR ratios in low-volatility markets and more conservative settings in high-volatility markets. Optimization reason: Different volatility environments have different profit potentials; dynamic adjustment can optimize expected returns per trade.
-
Optimize Scaling Conditions: Current scaling conditions are relatively loose; consider adding trend strength confirmation or only scaling in when price retraces to key support/resistance levels. Optimization reason: Stricter scaling conditions can improve the success rate of additional positions and reduce overall risk.
-
Market Environment Filtering: Add macro market environment filters, such as volatility indicators (like VIX) or trend strength indicators, to reduce or pause trading in unfavorable market environments. Optimization reason: Strategy performance varies greatly across different market phases; environment filtering can avoid trading under unfavorable conditions.
-
Adaptive Stop-Loss Strategy: Develop an adaptive stop-loss strategy based on market structure, such as using previous highs and lows, volatility percentages, or price structure as dynamic stop-loss reference points. Optimization reason: Fixed ATR multiplier stops sometimes do not match market structure well; adaptive methods can better fit actual price behavior.
Summary
The Dynamic Slope Dual-SMA Narrow-Band Breakout Quantitative Trading Strategy is a comprehensive trading system combining multiple technical analysis elements, providing traders with a structured market participation approach through precisely defined entry conditions, multi-level confirmation mechanisms, and a complete risk management framework. The strategy is based on fundamental technical analysis concepts such as SMA, ATR, and price action, but integrates these elements into a clear and organized trading system through Oliver Velez's methodology.
The core advantage of the strategy lies in its ability to identify high-probability breakout opportunities in moving average narrow-band areas and confirm signal validity through specific price patterns such as "Elephant Bars" and "Color Changes." Meanwhile, a comprehensive risk management structure ensures capital safety and profit protection.
However, the strategy also faces issues such as parameter sensitivity, false breakout risk, and money management challenges. By optimizing narrow-band thresholds, enhancing moving average systems, improving slope calculation, adding volume confirmation, implementing dynamic risk-reward ratios, optimizing scaling conditions, adding market environment filtering, and developing adaptive stop-loss strategies, the strategy's robustness and adaptability can be further enhanced.
Overall, this is a reasonably designed, logically clear quantitative trading strategy suitable for investors with certain trading experience, especially those who prefer technical analysis and systematic trading approaches. With appropriate parameter optimization and risk management, this strategy has the potential to achieve stable trading performance in various market environments.
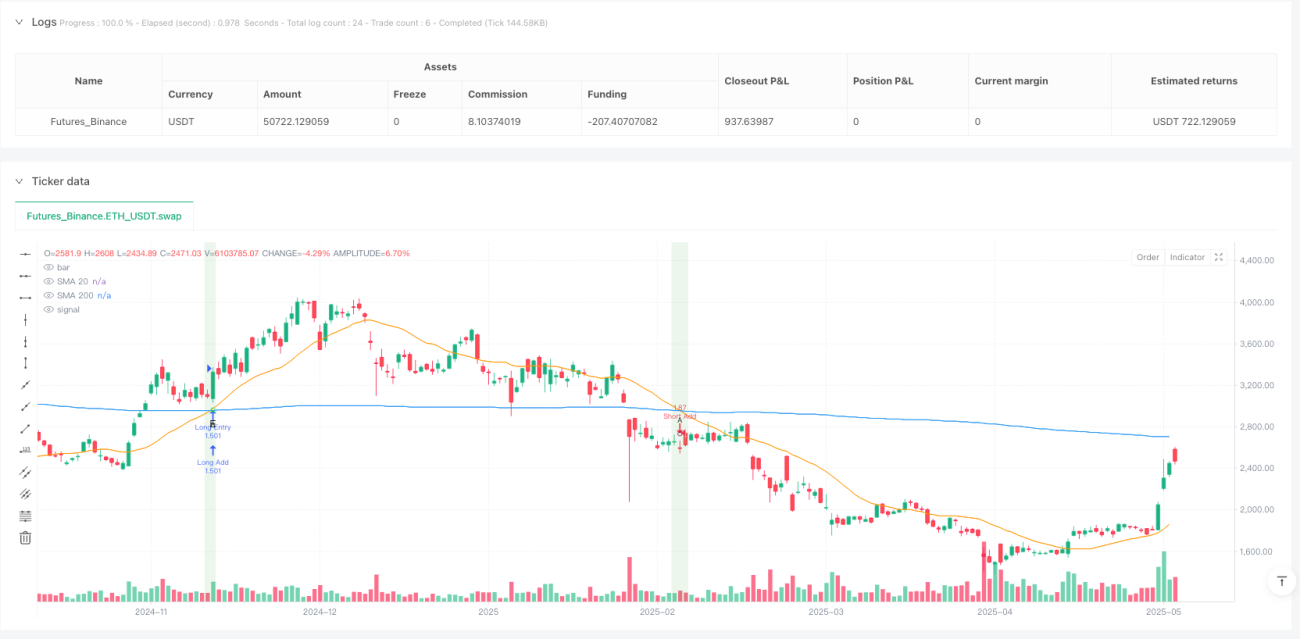
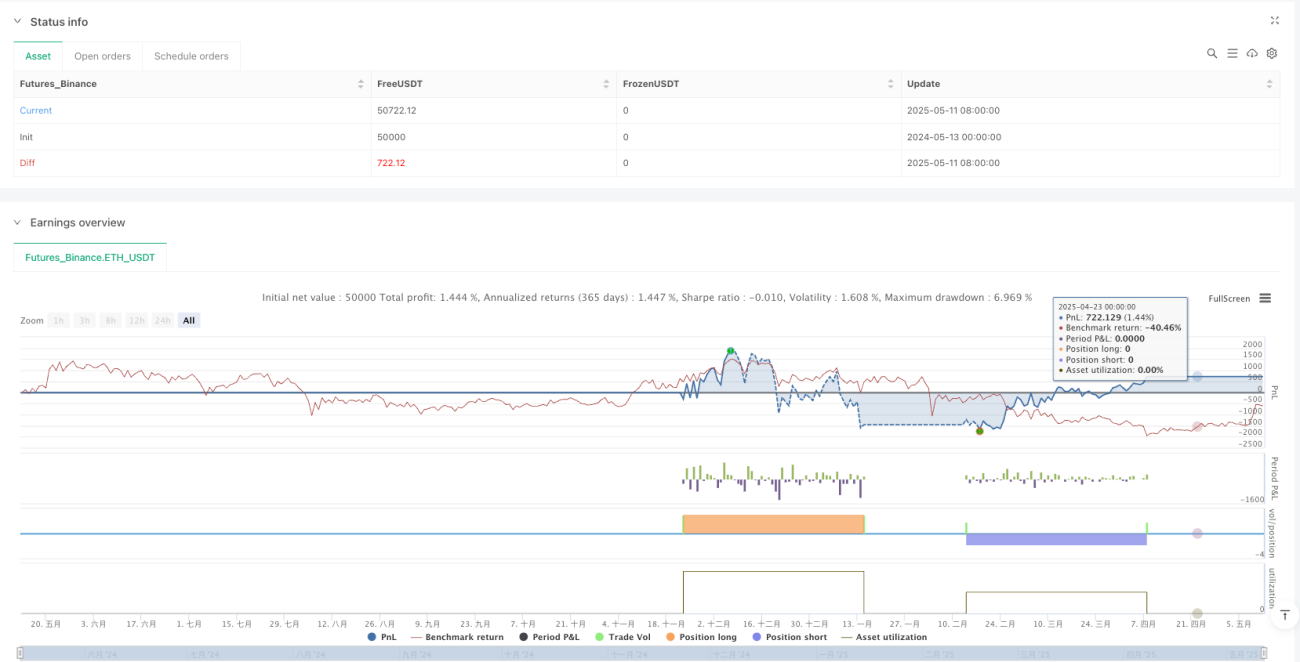
/*backtest
start: 2024-05-13 00:00:00
end: 2025-05-12 08:00:00
period: 1d
basePeriod: 1d
exchanges: [{"eid":"Futures_Binance","currency":"ETH_USDT"}]
*/

//@version=5
strategy("Oliver Velez Advanced Strategy v2", overlay=true, default_qty_type=strategy.percent_of_equity, default_qty_value=10, pyramiding=2, calc_on_order_fills=true, calc_on_every_tick=true)

// === INPUTS ===- 1