Dynamic Fibonacci Trend-Confirmed Crossover Engine Quantitative Strategy

Overview
The Dynamic Fibonacci Trend-Confirmed Crossover Engine Quantitative Strategy is a price action-based quantitative trading system that combines multiple technical analysis indicators and filtering conditions. The strategy primarily identifies engulfing patterns as entry signals within specific market contexts, while utilizing macro trend confirmation and dynamic Fibonacci levels for filtering, ultimately managing positions through EMA/MA crossovers and adaptive stop mechanisms. The core feature of this strategy is the integration of traditional technical analysis methods with modern quantitative tools, enhancing trading signal reliability through multi-timeframe analysis. This system is particularly suited for capturing reversal points in clearly trending markets while offering flexible parameter adjustments to adapt to different trading styles and market environments.
Strategy Principles
The core principles of this strategy are based on a multi-layered market analysis framework, comprising the following key components:
-
Trend Detection Mechanism: The strategy uses a fixed 160 candles to determine the macro trend direction. By continuously comparing opening and closing prices within a 1440-minute (daily) timeframe, it calculates the persistence of uptrends and downtrends to determine whether the market is in a defined uptrend, downtrend, or consolidation state.
-
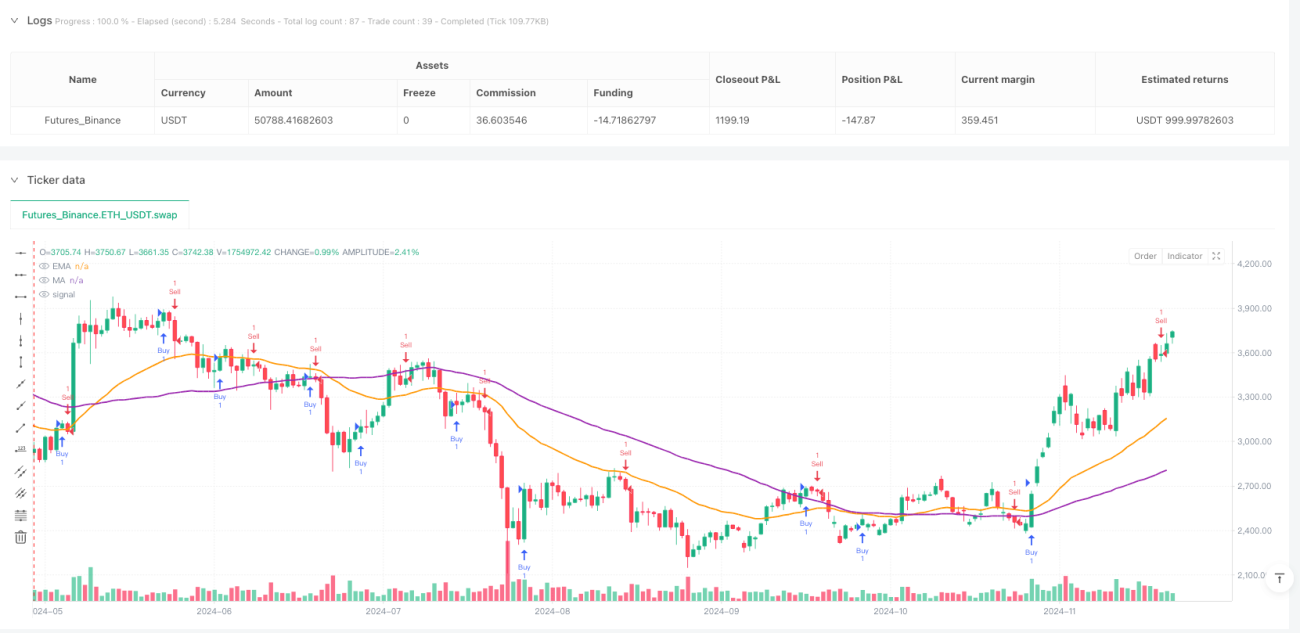
Engulfing Pattern Recognition: Within a user-defined timeframe (default: daily), the strategy identifies candle formations with engulfing characteristics. A bullish engulfing pattern requires the current closing price to be higher than the previous candle's opening price, the current opening price lower than the previous candle's closing price, and both the current high and low points to be higher than their respective points in the previous candle. Bearish engulfing patterns follow the opposite conditions.
-
Dynamic Fibonacci Level Adjustment: The strategy calculates Fibonacci retracement and extension levels (0%, 38.2%, 50%, 61.8%, 78.6%, 100%, and extensions at -61.8% and 161.8%) based on the highest and lowest prices within the user-selected timeframe, providing a reference framework for price action analysis.
-
McGinley Dynamic Indicator: This indicator is an improved moving average that offers more responsive price tracking capability through an adjustable alpha parameter (default 0.7), helping to confirm trend direction and strength.
-
Moving Average Crossover System: The strategy incorporates crossover points between a 32-period Exponential Moving Average (EMA) and a 64-period Simple Moving Average (MA) as potential profit-taking or reversal signals.
-
Entry and Management Mechanism:
- When a bullish engulfing pattern is identified and the uptrend count doesn't exceed 16, the strategy initiates a long position.
- When the high point breaks above the previous high, it adds to the long position.
- When the downtrend count doesn't exceed 32 and a bearish engulfing pattern appears, it triggers take-profit or stop-loss exits.
- The logic for bearish signals is similar but in the opposite direction.
-
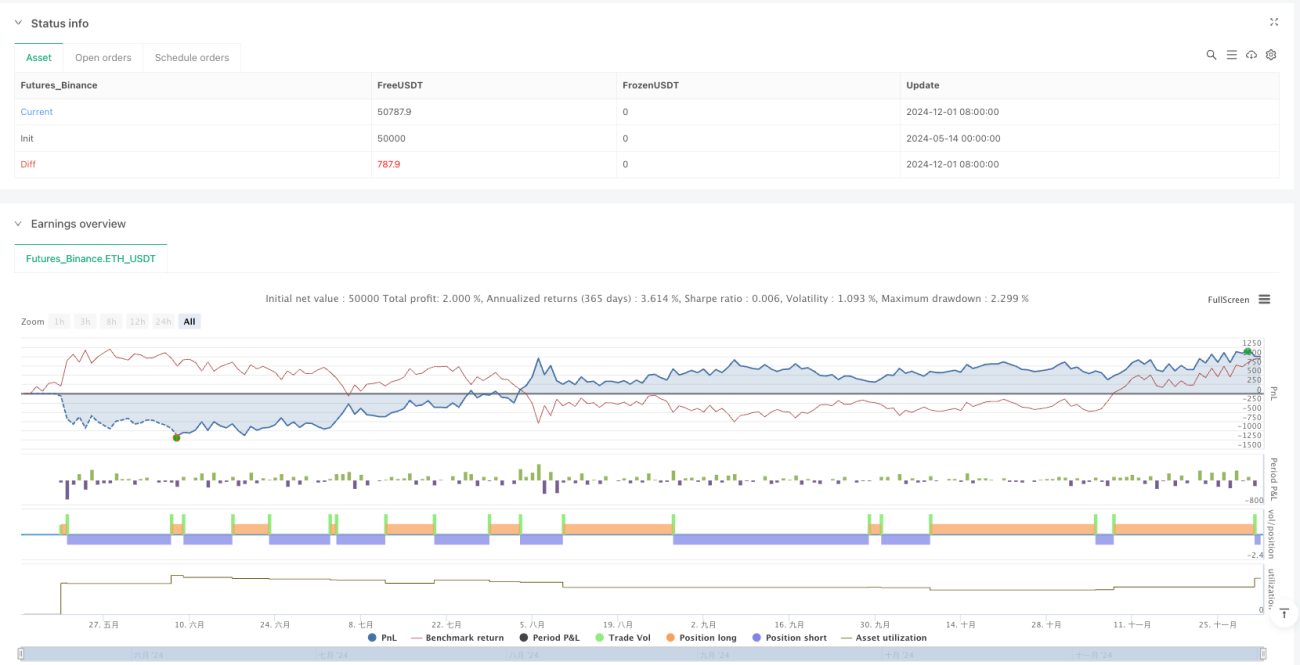
Risk Management: The strategy sets percentage-based take-profit and stop-loss levels (default: both at 10%), calculating absolute price levels dynamically based on the entry price.
Strategy Advantages
-
Multi-layered Confirmation Mechanism: By combining trend analysis, candle patterns, and technical indicators, the strategy creates a multi-layered signal confirmation system that significantly reduces the possibility of false signals.
-
Adaptive Market Framework: The strategy not only considers a fixed trend timeframe but also allows users to customize the secondary analysis timeframe, enhancing the strategy's ability to adapt to different market cycles.
-
Dynamic Reference Points: Through the combination of the McGinley Dynamic indicator and Fibonacci levels, the strategy provides more flexible reference points that better adapt to market volatility and non-linear characteristics.
-
Incremental Position Building: At breakthrough points following confirmed signals, the strategy allows for position additions, optimizing capital management and enhancing profit potential.
-
Comprehensive Exit Strategy: Combining technical indicator crossovers with fixed percentage take-profit/stop-loss points, the strategy establishes a comprehensive exit framework that balances profit-locking and risk control needs.
-
Visual Feedback: The strategy provides visual feedback through labels and lines, helping traders understand the market environment and strategy decisions.
-
Flexible Parameter Adjustment: Key parameters such as the McGinley Dynamic indicator sensitivity (alpha) and take-profit/stop-loss percentages can be adjusted according to user preferences and market conditions.
Strategy Risks
-
Parameter Sensitivity: The strategy relies on multiple fixed parameters (such as the 160 candles for trend detection, 32 periods for EMA, and 64 periods for MA), which may not be optimal in different market environments, leading to performance fluctuations. Solution: Implement adaptive parameter optimization mechanisms that dynamically adjust parameters based on market volatility.
-
Frequent Trading Risk: In highly volatile markets, engulfing patterns may appear frequently but lack substantive significance, leading to overtrading and increased transaction costs. Solution: Add additional filtering conditions, such as volume confirmation or volatility thresholds.
-
False Breakout Risk: Price may quickly retrace after breaking above/below previous highs/lows, making position-addition signals unreliable. Solution: Implement breakout confirmation mechanisms, such as requiring price to maintain a certain duration or magnitude after breakout.
-
Fixed Stop-Loss Limitations: Using fixed percentage stop-losses may trigger too early in highly volatile markets or be too loose in low-volatility markets. Solution: Implement ATR-based adaptive stop-loss strategies that adjust stop levels according to actual market volatility.
-
Trend Detection Delay: Trend detection based on historical data may lag behind actual market turning points. Solution: Integrate forward-looking trend indicators, such as Relative Strength Index (RSI) divergence or MACD signals.
-
Timeframe Conflicts: Signals from different timeframes may contradict each other, causing strategy confusion. Solution: Establish a timeframe priority system or implement a multi-timeframe coordination mechanism.
-
Market State Dependency: The strategy performs best in clearly trending markets but may underperform in consolidating, sideways markets. Solution: Add market state detection logic and employ different trading strategies for different market states.
Strategy Optimization Directions
-
Adaptive Parameter System: Transform key parameters such as EMA/MA periods and trend detection windows into adaptive parameters that automatically adjust based on market volatility and recent trend strength. This can improve the strategy's adaptability across different market environments while reducing curve-fitting risks.
-
Enhanced Trend Detection: The existing trend detection is based on simple price comparisons and can be enhanced by integrating more complex trend strength indicators such as Directional Movement Index (DMI), Average Directional Index (ADX), or linear regression slopes. This will provide more accurate trend assessments and reduce false signals.
-
Volume Confirmation Mechanism: Integrate volume analysis into the signal confirmation process, especially for engulfing patterns and breakout signals. Engulfing patterns with abnormally high volume typically have higher reliability and can serve as an additional filtering layer.
-
Dynamic Position Sizing: The current strategy uses fixed unit position sizes and can implement dynamic position sizing based on market volatility or account risk proportion to optimize capital management and risk control.
-
Refined Exit Strategy: More complex, staged profit-taking strategies can be developed, such as moving stop-losses to breakeven after reaching certain profit levels, or partially reducing positions based on key price levels, thereby locking in partial profits while maintaining upside potential.
-
Volatility Adjustment Mechanism: Integrate market volatility (such as ATR or historical volatility) into the strategy logic to adjust entry conditions, stop-loss levels, and profit targets, enabling the strategy to maintain stable performance across different volatility environments.
-
Machine Learning Enhancement: Utilize machine learning algorithms to optimize parameter selection and identify market environments most favorable for strategy execution, or even train models to predict the success probability of engulfing patterns and trend confirmations.
-
Seasonality and Time Filters: Analyze the strategy's performance across different market sessions, day-of-week, and monthly cycles, and potentially disable trading during historically underperforming time periods to improve overall stability.
Summary
The Dynamic Fibonacci Trend-Confirmed Crossover Engine Quantitative Strategy represents a comprehensive technical trading approach that successfully integrates traditional price action analysis (such as engulfing patterns) with modern quantitative tools (such as the McGinley Dynamic indicator and multi-timeframe analysis). The core strengths of this strategy lie in its multi-layered signal confirmation system and flexible parameter adjustment capabilities, enabling it to adapt to various market environments.
However, the strategy also faces risks related to parameter sensitivity, false signals, and market state dependency. By implementing the suggested optimization measures, particularly adaptive parameter systems, enhanced trend detection, and dynamic risk management, the strategy's robustness and long-term performance can be significantly improved.
Overall, this strategy provides a solid quantitative trading foundation suitable for experienced traders to further customize and refine to match their specific risk preferences and trading objectives. Its comprehensive design considers both technical accuracy and practical applicability and scalability, making it a valuable component in the modern quantitative trading toolkit.
- 1