
Overview
The Multi-Indicator Trend Confirmation and Volatility Breakout Trading Strategy is a quantitative trading system that integrates multiple technical indicators, primarily combining Bollinger Bands (BB), Moving Average Convergence Divergence (MACD), Simple Moving Average (SMA), Relative Strength Index (RSI), and Volume Weighted Average Price (VWAP) to generate trading signals. The core concept of this strategy is to cross-validate market trends through multiple indicators, capturing high-probability trading opportunities when price touches Bollinger Band boundaries, combined with MACD signals and SMA trend confirmation. The strategy incorporates a comprehensive risk management mechanism, including stop-loss, take-profit, and trailing stop settings, effectively controlling risk exposure for each trade.
Strategy Principles
The trading logic of this strategy is based on the following core principles:
-
Indicator Combination and Signal Generation:
- Uses Bollinger Bands (BB) to identify price volatility boundaries, considering long signals when price touches the lower band and short signals when it touches the upper band
- Employs MACD indicator to confirm momentum direction, requiring MACD line above signal line (macdLine > signalLine) for long signals, and below for short signals
- Uses 50-period SMA to confirm overall market trend, requiring price above SMA for long signals and below SMA for short signals
- Comprehensive trend determination (isBullish/isBearish) additionally requires the price position relative to BB middle band to align with the respective trend
-
Entry Conditions:
- Long entry condition: price below BB lower band && MACD line above signal line && meeting overall bullish conditions
- Short entry condition: price above BB upper band && MACD line below signal line && meeting overall bearish conditions
-
Risk Management System:
- Stop-loss setting: Default at 1% of entry price
- Take-profit target: Default at 2% of entry price
- Trailing stop: Default at 0.5%, allowing profit protection in trending markets
-
Visualization and Decision Support:
- Provides intuitive price position reference through BB, VWAP, and SMA lines
- Real-time display of various technical indicator values and their signal status
- Uses background color to identify current market trend state
From code analysis, although the strategy calculates RSI and VWAP indicators, it primarily relies on BB, MACD, and SMA as core indicators for actual entry signal determination, possibly to avoid overfitting and enhance strategy robustness.
Strategy Advantages
This Multi-Indicator Trend Confirmation and Volatility Breakout Trading Strategy offers the following significant advantages:
-
Multi-dimensional Signal Confirmation: By requiring multiple indicators to simultaneously meet specific conditions, it effectively reduces the probability of false signals. This "consensus mechanism" ensures that trading signals are triggered only when price volatility (BB), momentum (MACD), and trend (SMA) dimensions all point in the same direction.
-
Adaptive Market Conditions: Bollinger Bands, as a core indicator, automatically adjusts the width of upper and lower bands according to market volatility, enabling the strategy to adapt to different market volatility environments, avoiding excessive signals during low volatility periods or missing important opportunities during high volatility periods.
-
Comprehensive Risk Management Framework: Incorporates a triple protection mechanism (fixed stop-loss, take-profit target, and trailing stop), not only protecting capital from significant losses but also securing profits in trending markets. This balanced risk-reward setup (1% risk corresponding to 2% reward) aligns with professional trading risk management principles.
-
Visualized Trading Environment: Provides a comprehensive graphical interface, including Bollinger Band filled areas, trend background colors, entry signal markers, and stop-loss and target price lines. Additionally, the technical indicator table offers real-time indicator status, helping traders quickly assess current market conditions.
-
High Customizability: All key parameters are exposed to users through input variables, including period lengths for various indicators and risk management parameters, allowing traders to optimize adjustments based on personal preferences, trading instruments, and time frames.
-
Integrated Alert Functionality: Built-in alert conditions for buy and sell signals enable traders to receive real-time trade opportunity notifications without continuously monitoring the market.
Strategy Risks
Despite its comprehensive design, the strategy still presents the following potential risks and limitations:
-
Poor Performance in Sideways Markets: In oscillating markets lacking clear trends, the strategy may generate frequent false signals leading to consecutive stop-losses. This is particularly likely when prices fluctuate between upper and lower Bollinger Bands without forming sustained trends.
-
Limitations of Fixed Percentage Risk Control: Using fixed percentage stop-loss and take-profit may not be suitable for all market environments. In highly volatile markets, a 1% stop-loss may be too tight and frequently triggered; while in low volatility markets, a 2% take-profit target may be too distant to achieve.
-
Parameter Sensitivity: The strategy relies on multiple technical indicators, each with specific parameters. Improper parameter settings may significantly reduce strategy performance. For example, the SMA period (default 50) if set inappropriately may not accurately reflect the current market trend.
-
Over-reliance on Historical Correlations: The strategy assumes that historical relationships between MACD, BB, and SMA will remain effective in the future. However, changing market conditions may weaken or invalidate these correlations, especially when market structure undergoes significant changes.
-
Ignoring Fundamental Factors: As a pure technical analysis strategy, it completely ignores fundamental factors that may significantly impact prices, such as economic data, policy changes, or special events, which could lead to substantial losses in certain market environments.
-
Lack of Volume Confirmation: Although VWAP is calculated, volume information is not fully utilized as a confirmation factor in actual trading signals, potentially generating misleading signals under low liquidity conditions.
Strategy Optimization Directions
Based on in-depth analysis of the strategy logic, the following optimization directions can be considered:
-
Dynamic Parameter Adjustment Mechanism: Introduce an adaptive parameter system that automatically adjusts stop-loss and take-profit levels based on market volatility. For example, expanding stop-loss range in high volatility markets and tightening take-profit targets in low volatility markets can improve strategy adaptability across different market environments.
-
Integration of Market State Classification: Develop a market environment recognition module capable of distinguishing between trending and oscillating markets, and adjust strategy parameters or even switch between different trading logics based on different market states. This can address the strategy's poor performance in sideways markets.
-
Incorporate Volume Analysis: Integrate VWAP and volume changes into the signal confirmation mechanism, requiring important breakout signals to be supported by corresponding trading volume, which will filter out some low-quality price breakouts.
-
Optimize Signal Filters: Add additional signal quality filtering conditions, such as requiring breakout signals to persist for multiple time periods, or adding minimum threshold requirements for breakout magnitude, to reduce the impact of false breakouts.
-
Add Time Filters: Reduce or avoid trading during known periods of low trading activity (such as early Asian session or Euro-American transition periods), which can lower the risk of slippage and poor execution in low liquidity sessions.
-
Multi-timeframe Analysis: Integrate trend information from higher time frames as trade direction filters, for example, only trading in smaller time frames in the direction of the daily trend, which can improve the overall win rate of the strategy.
-
Introduce Machine Learning Elements: Dynamically evaluate the weights of different indicators through machine learning algorithms, automatically adjusting the importance of each indicator in decision-making based on recent market behavior, enabling the strategy to better adapt to evolving market characteristics.
Summary
The Multi-Indicator Trend Confirmation and Volatility Breakout Trading Strategy is a well-structured quantitative trading system that identifies high-quality trading opportunities through a multi-dimensional combination of technical indicators (BB, MACD, SMA, etc.), while incorporating professional risk management mechanisms. The core advantages of this strategy lie in its stringent conditions for signal confirmation and comprehensive visualization decision support, making it suitable for investors seeking systematic trading methods.
Despite some inherent risks, such as poor performance in sideways markets and sensitivity to parameter settings, these limitations can be significantly improved through the proposed optimization directions, including dynamic parameter adjustment, market state classification, and multi-timeframe analysis. In particular, the suggestion to introduce machine learning elements will provide the strategy with the ability to adapt to market changes, representing a frontier development direction in quantitative trading.
In conclusion, this strategy represents a balanced and comprehensive technical analysis trading approach, suitable for traders with a certain foundation in technical analysis. Through reasonable parameter optimization and suggested improvement measures, it has the potential to become a robust and reliable trading tool, helping traders gain consistent trading advantages in complex and dynamic market environments.
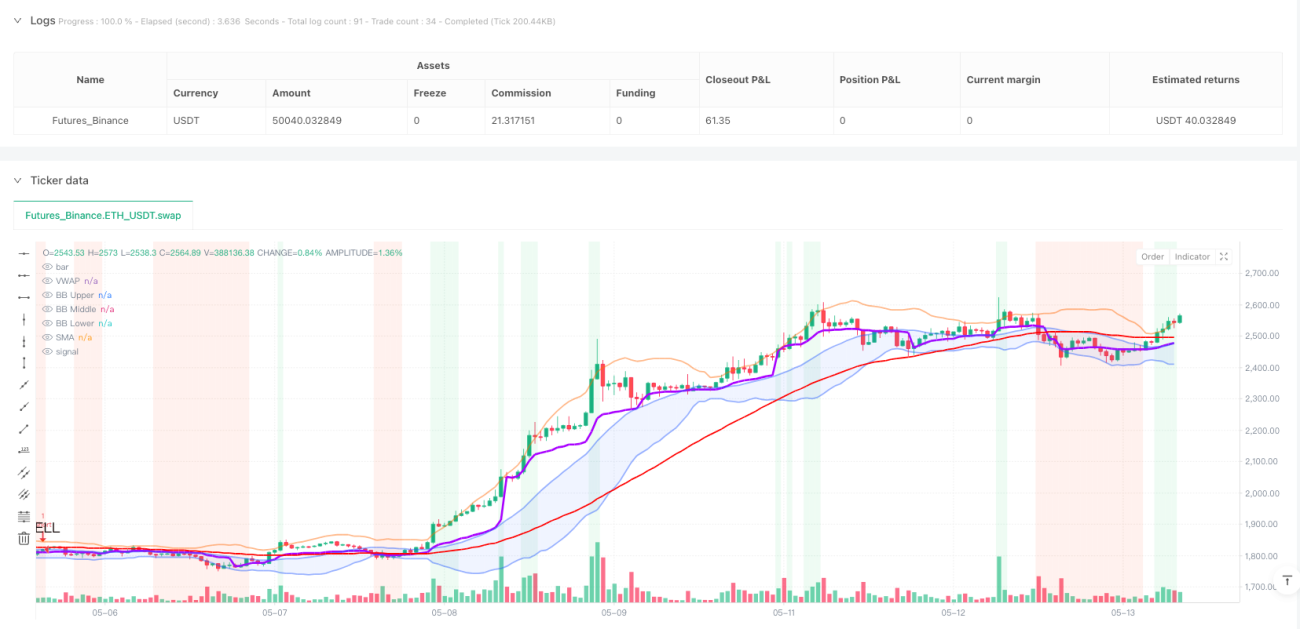
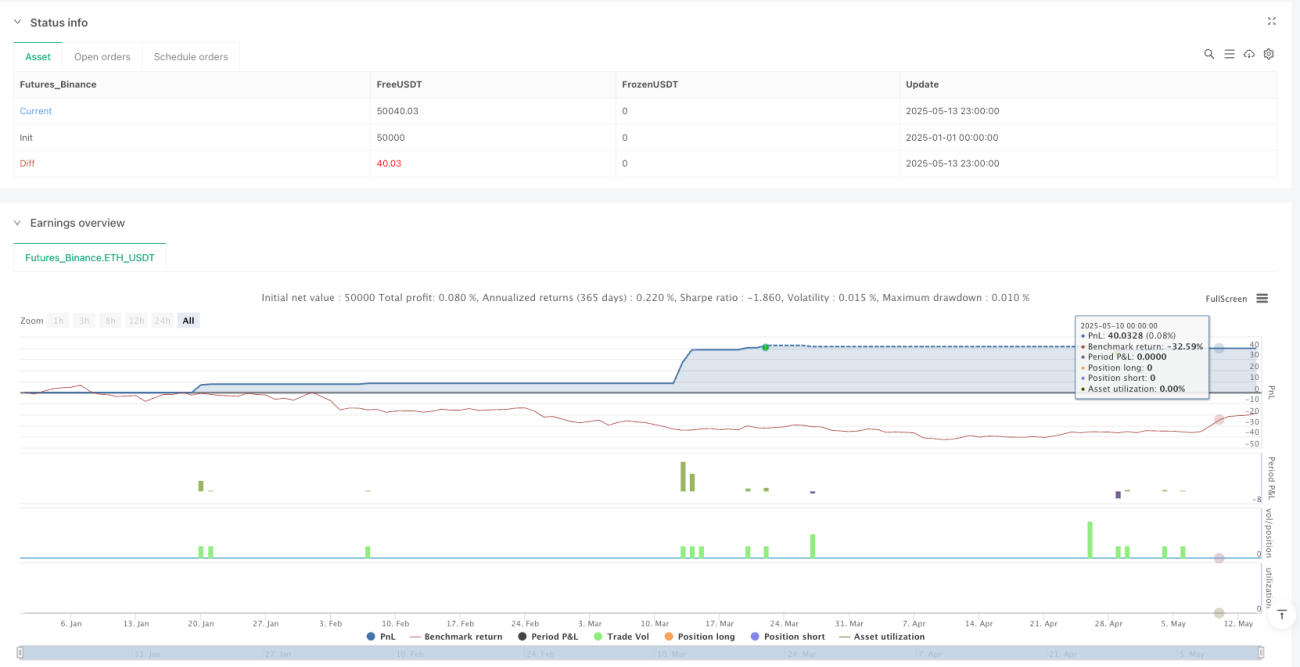
/*backtest
start: 2025-01-01 00:00:00
end: 2025-05-14 00:00:00
period: 1h
basePeriod: 1h
exchanges: [{"eid":"Futures_Binance","currency":"ETH_USDT"}]
*/

// This Pine Script® code is subject to the terms of the Mozilla Public License 2.0 at https://mozilla.org/MPL/2.0/
// © vivekm8955
//@version=5
strategy("RSI/BB/MACD/VWAP/SMA Strategy [vivekm8955]", overlay=true, margin_long=100, margin_short=100)- 1