Dynamic Price Range and RSI Divergence Trading Strategy: Multi-Period Moving Average Trend Filtering and Dynamic Position Management Optimization

Overview
The Dynamic Price Range and RSI Divergence Trading Strategy is a comprehensive quantitative trading system that combines price range detection, RSI indicator divergence signals, and moving average trend analysis. This strategy is specifically designed for the OKX Signal Bot platform, featuring advanced functionalities such as dynamic position adjustment and partial position closing. The strategy primarily identifies price range breakout points, combines them with RSI indicator divergence signals, and filters market trends through multi-period moving averages, thereby seeking long opportunities in downtrends to achieve precise trade timing.
The uniqueness of this strategy lies in its dynamic position management system, which adjusts trading size based on the difference between the current price and the average position price. This enables the strategy to increase positions as prices continue to move favorably while gradually reducing positions when prices begin to reverse, thereby optimizing capital efficiency and risk-reward ratio.
Strategy Principles
The strategy is based on three core components working in concert:
-
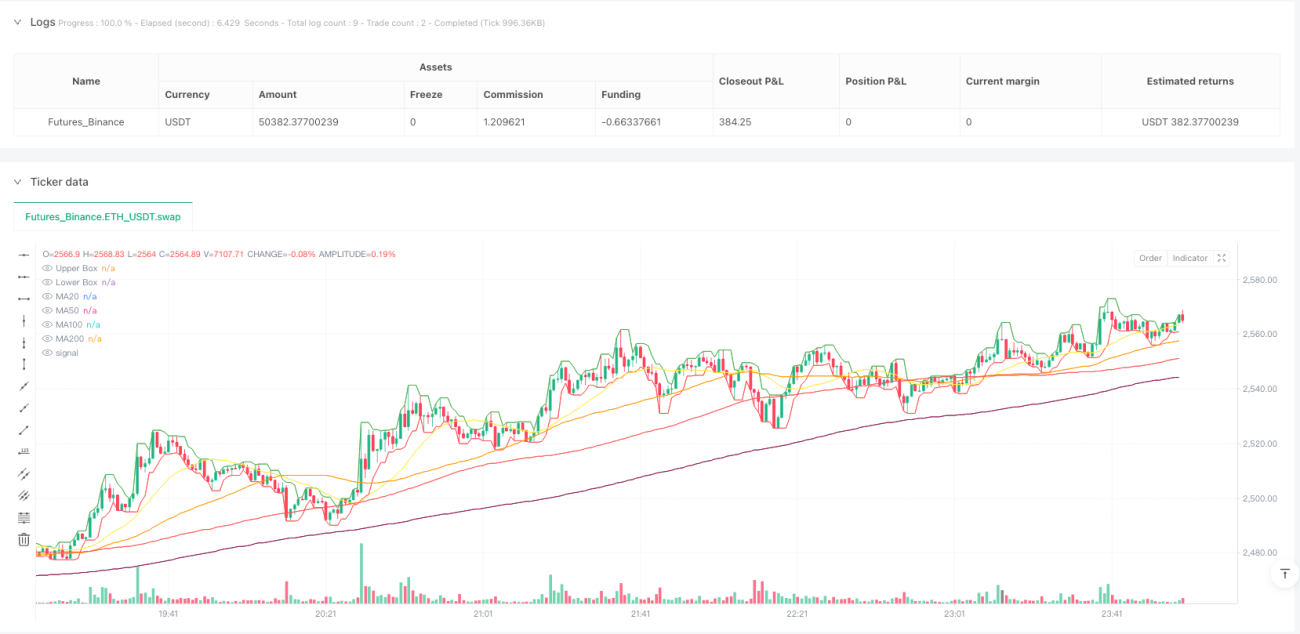
Price Range Detection: The strategy determines the price range by calculating the highest high and lowest low within a specific period (set by the boxLength parameter). These price levels are plotted on the chart as upper and lower boundary lines, providing visual price reference ranges for trading.
-
RSI Divergence Detection: The strategy uses the Relative Strength Index (RSI) to calculate market momentum and detects divergence phenomena between price and RSI. Bullish divergence forms when price makes a lower low while RSI makes a higher low; bearish divergence forms when price makes a higher high while RSI makes a lower high. The strategy precisely identifies local extrema by setting left and right lookback periods (leftLookback and rightLookback).
-
Moving Average Trend Analysis: The strategy calculates various types of moving averages (MA20, MA50, MA100, and MA200) on a custom timeframe, determining market trends by analyzing the arrangement of these moving averages and the position of price relative to them. The strategy only triggers long signals in downtrends to ensure trades are consistent with the overall market environment.
The trading logic is as follows:
- Long Signal: Triggered when price breaks through the lower boundary and RSI bullish divergence is detected, ensuring execution only under downtrend conditions. The system dynamically adjusts position size based on the difference between current price and average position price.
- Position Reduction Signal: Triggered when price breaks through the upper boundary and RSI bearish divergence is detected, ensuring execution only under uptrend conditions. The system dynamically closes part of the position based on price movement relative to the average position price.
Strategy Advantages
-
Multi-dimensional Confirmation Mechanism: Combining price range breakouts, RSI divergence signals, and moving average trend filtering creates a multi-dimensional trade confirmation system, significantly improving the reliability and precision of trading signals.
-
Dynamic Position Management: The strategy dynamically adjusts position size based on market conditions and price movements, rather than using fixed position allocation. This allows the strategy to maximize profit potential in favorable market environments while controlling risk under unfavorable conditions. The formula
math.max(math.min(math.pow((avgPrice - close)* 1000/5,1.1), 100), minEnterPercent)ensures position adjustments are both flexible and limited. -
Adaptive Market Environment: Through analysis of moving average crossovers and arrangements, the strategy can adapt to different market environments, executing trades only when technical patterns align with the overall trend.
-
Precise Entry and Exit Points: Divergence signals combined with price range breakouts provide precise entry and exit points, reducing the possibility of false signals. Lookback parameters (leftLookback and rightLookback) enhance the accuracy of extrema point identification.
-
Visual Feedback: The strategy plots price ranges, moving averages, and trade signal labels on the chart, providing intuitive visual feedback that helps traders understand and verify trading decisions.
-
Flexible Parameter Configuration: Multiple adjustable parameters allow the strategy to adapt to different markets and trading styles, such as RSI length, price range period, and divergence lookback period.
Strategy Risks
-
False Breakout Risk: Price range breakouts can sometimes be temporary rather than the start of an actual trend. This may lead to unnecessary trades and losses. Methods to reduce this risk include adding confirmation factors, such as extending lookback periods or incorporating volume confirmation.
-
Overtrading Risk: Dynamic position adjustment may lead to overtrading, increasing transaction costs. It is recommended to set reasonable minimum adjustment thresholds (minEnterPercent and minExitPercent) to avoid frequent trades triggered by minor price fluctuations.
-
Moving Average Lag Risk: Moving averages have inherent lag, especially in rapidly turning markets. This risk can be mitigated by adjusting the type of moving average used (e.g., switching from SMA to EMA) or adjusting moving average periods.
-
Parameter Sensitivity: The strategy relies on multiple parameters, such as RSI thresholds and moving average periods, where small changes can significantly impact strategy performance. It is recommended to backtest different parameter combinations to find robust settings and periodically re-optimize parameters to adapt to changing market conditions.
-
Single Market Dependency: The strategy may perform well in certain market conditions but poorly in others. It is advisable to test the strategy across different market environments and timeframes, and consider adding market state filters to pause trading during unsuitable market conditions.
Optimization Directions
-
Add Volume Confirmation: The current strategy relies solely on price and RSI indicators for trading decisions. Adding volume analysis can verify the validity of price range breakouts, avoiding false breakouts with insufficient volume. This can be implemented by checking whether the volume at breakout is higher than the average volume of the previous few periods.
-
Introduce Volatility Adjustment Mechanism: During high volatility periods, add signal filters or adjust the position sizing formula to reduce false signal risks and control maximum risk exposure. The ATR (Average True Range) indicator can be used to quantify volatility and dynamically adjust trading parameters.
-
Add Risk-Reward Ratio Filtering: Estimate the potential risk-reward ratio before each trade and only execute trades that meet a minimum risk-reward ratio threshold, optimizing overall strategy expected returns. This can be implemented by setting dynamic stop-loss and take-profit levels based on ATR.
-
Incorporate Multi-timeframe Analysis: Improve signal quality by adding trend confirmation on higher timeframes. For example, only execute trades when the daily trend aligns with the current trading timeframe trend.
-
Improve Dynamic Position Algorithm: The current power function may produce excessively large or small adjustments in extreme cases. Consider more complex algorithms, such as adaptive formulas based on market volatility and current profit/loss status, or introduce risk exposure limits to ensure individual trades do not excessively impact the overall portfolio.
-
Add Automatic Parameter Optimization: Implement automatic parameter optimization loops that periodically adjust strategy parameters based on recent market data, allowing the strategy to better adapt to changing market conditions. This can be achieved through backtesting frameworks or machine learning algorithms.
Summary
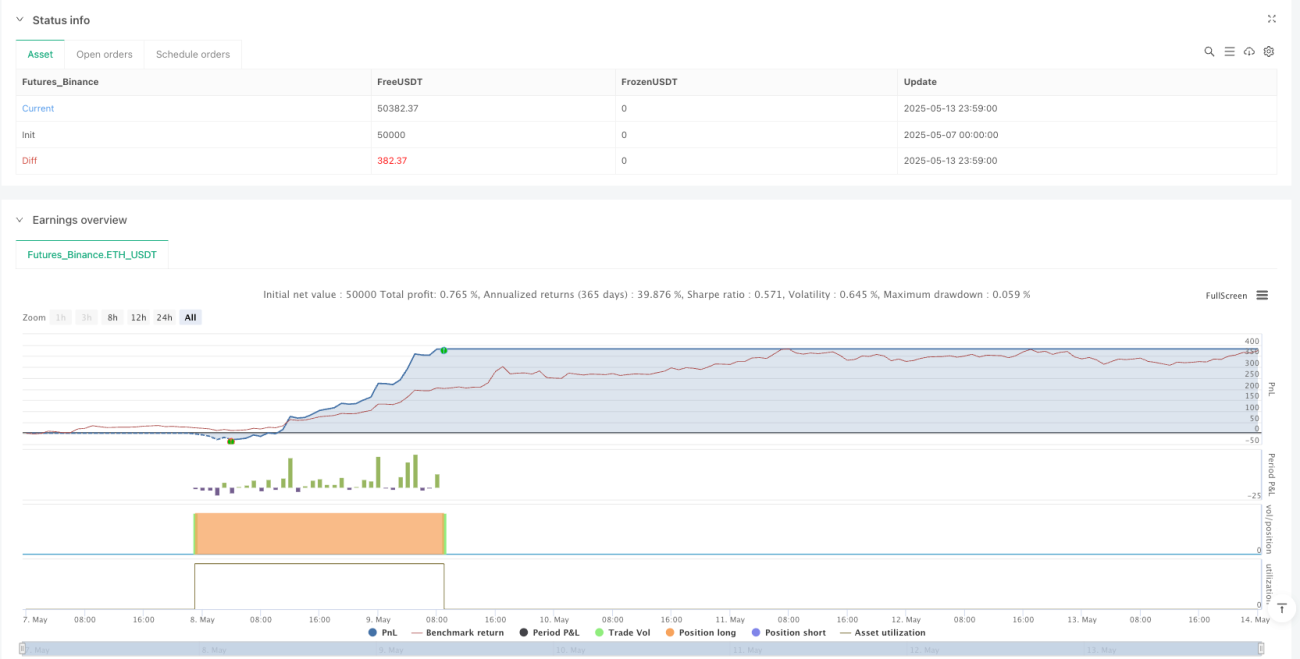
The Dynamic Price Range and RSI Divergence Trading Strategy is an advanced quantitative trading system that combines multiple technical analysis methods, integrating price ranges, RSI divergence, and moving average trends to provide a powerful trading decision framework. Its greatest advantage lies in the dynamic position management system, which automatically adjusts trading size according to market conditions, optimizing capital efficiency while maintaining risk control.
Although the strategy has some inherent risks, such as false breakouts and parameter sensitivity, through the suggested optimization directions—including adding volume confirmation, introducing volatility adjustment, and multi-timeframe analysis—the robustness and adaptability of the strategy can be further enhanced. For traders looking to deploy advanced strategies on automated trading platforms like OKX Signal Bots, this provides a flexible and powerful foundational framework that can be customized and extended according to personal trading styles and market preferences.
- 1