Dynamic Anchored VWAP and Volume Distribution Liquidity Capture Strategy

Overview
The Dynamic Anchored VWAP and Volume Distribution Liquidity Capture Strategy is a quantitative trading approach based on price deviation from value areas and volume anomalies. This strategy primarily utilizes daily recalculated anchored Volume Weighted Average Price (VWAP) and the Point of Control (POC) from volume distribution as key reference points, combined with the Relative Strength Index (RSI) and volume anomaly detection to capture trading opportunities when price deviates from value areas with sufficient liquidity support. The strategy incorporates a complete stop-loss and take-profit mechanism, dynamically adjusting risk management parameters through Average True Range (ATR), aiming to efficiently capture liquidity events in the market while controlling risk.
Strategy Principles
The core principle of this strategy is to identify deviations between price and value anchor points (VWAP and POC), combined with volume and momentum indicator confirmation, to capture liquidity opportunities in the market. The specific implementation principles are as follows:
-
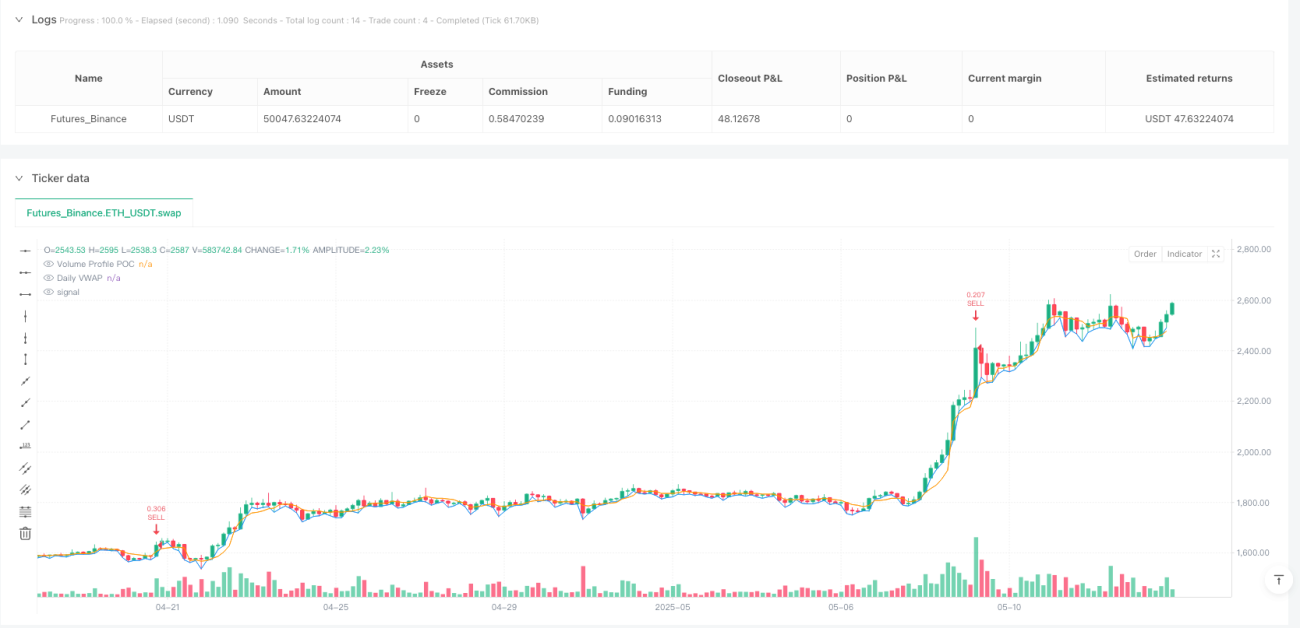
Dynamic Anchored VWAP Calculation: The strategy reanchors the VWAP calculation at the beginning of each trading day, ensuring that VWAP reflects the price-weighted conditions of the current day. VWAP is dynamically updated through accumulated volume (cumVol) and accumulated price multiplied by volume (cumPV).
-
Volume Distribution Analysis: By dividing the price range into multiple levels (default 24 levels), the strategy records the volume for each price range and identifies the midpoint of the range with the maximum volume as the POC (Point of Control). This process is reset each trading day to ensure the POC reflects the current day's volume distribution.
-
Signal Generation Logic:
- Buy Signal: Triggered when the price is below both VWAP and POC, while volume exceeds 3 times (adjustable parameter) the 20-day average volume, and RSI is below 40.
- Sell Signal: Triggered when the price is above both VWAP and POC, while volume exceeds 3 times the 20-day average volume, and RSI is above 60.
-
Risk Management: Stop-loss and take-profit levels are dynamically set based on ATR (Average True Range). The strategy defaults to using 1.5 times ATR as the stop-loss distance and 2 times ATR as the take-profit distance, ensuring a risk-reward ratio of 1:1.33.
Strategy Advantages
-
Multiple Confirmation Mechanism: The strategy filters signals through three conditions: price deviation from two key value anchor points (VWAP and POC), volume anomaly, and RSI confirmation, effectively reducing the probability of false signals.
-
Dynamic Market Adaptation: Daily recalculated VWAP and volume distribution ensure that the strategy can adapt to different market environments, reflecting the latest price and volume conditions.
-
Price-Volume Relationship Analysis Framework: The strategy integrates price (VWAP), volume (Volume Profile), and momentum (RSI) analysis, building a complete price-volume relationship analysis framework.
-
Adaptive Risk Management: ATR-based stop-loss and take-profit settings allow risk management to automatically adjust according to market volatility, maintaining consistent risk control across different volatility environments.
-
Visual Confirmation Support: The strategy provides visualization of VWAP, POC, and signal markers, allowing traders to intuitively understand the strategy logic and signal generation process.
-
Liquidity Capture Advantage: By requiring above-average volume as a trading condition, the strategy focuses on capturing liquidity events in the market, improving trade execution efficiency and slippage control.
Strategy Risks
-
Over-reliance on Single-Day Data: The strategy resets VWAP and volume distribution calculations daily, which may lead to insufficient continuity between days, ignoring longer-term market structures. Consider adding multi-period VWAP or longer-term volume distribution as supplementary references.
-
Volume Anomaly Detection Sensitivity: The strategy uses a fixed volume multiplier (default 3x) to detect anomalies, which may require different parameter settings for different markets or different periods. An adaptive volume anomaly detection mechanism is recommended.
-
Fixed RSI Threshold Risk: Using fixed 40/60 RSI thresholds may not be suitable for all market environments, especially in trending markets where opportunities may be missed or too many signals may be generated. Consider dynamically adjusting RSI thresholds or incorporating trend identification mechanisms.
-
Small Stop-Loss Risk: In highly volatile markets, a 1.5x ATR stop-loss may be too small, leading to frequent stop-outs. Consider dynamically adjusting the stop-loss multiplier based on market environment or volatility characteristics.
-
Lack of Trend Filtering: The strategy lacks an explicit trend filtering mechanism and may generate counter-trend signals in strong trends. Consider adding a trend identification component to avoid counter-trend trading in strong trends.
Strategy Optimization Directions
-
Multi-Period VWAP Integration: Introduce VWAP from multiple time periods (such as hourly, 4-hour, and daily VWAP) to form a VWAP band, enhancing the strategy's multi-dimensional analysis capability. This can identify price deviations across different time frames and enhance signal reliability.
-
Adaptive Volume Threshold: Replace the fixed volume multiplier with an adaptive threshold based on volume volatility, such as using a Z-score or standard deviation multiplier for volume, to more accurately identify true volume anomalies.
-
Market State Classification: Add a market state identification module to distinguish between trending markets, range-bound markets, and high-volatility markets, adjusting strategy parameters and signal generation logic for different market states.
-
Time Filtering: Add time filtering functionality to avoid trading during high-volatility periods at market open and before close, or to focus on specific high-efficiency trading periods.
-
Enhanced Volume Distribution: Optimize volume distribution analysis by introducing Time Price Opportunity (TPO) analysis or considering multi-day cumulative volume distribution to obtain more stable market structure information.
-
Dynamic Take-Profit Mechanism: Implement a dynamic take-profit strategy based on market volatility or price structure, such as using trailing stops during strong breakouts to maximize profit potential.
-
Machine Learning Enhancement: Introduce machine learning algorithms to optimize parameter selection and signal generation, such as using decision trees or random forest algorithms to optimize multi-parameter combinations and improve strategy adaptability.
Summary
The Dynamic Anchored VWAP and Volume Distribution Liquidity Capture Strategy is a quantitative trading system based on price deviation from value areas combined with volume confirmation. By integrating VWAP, volume distribution POC, RSI, and volume anomaly detection, the strategy can effectively identify trading opportunities where price deviates from value areas with substantial volume support. The core advantages of the strategy lie in its multiple confirmation mechanisms and adaptive risk management, though it also has risks such as over-reliance on single-day data and lack of trend filtering. Future optimization directions mainly focus on multi-period analysis integration, adaptive parameter adjustment, market state classification, and dynamic take-profit mechanisms. Through these optimizations, the strategy is expected to further enhance its ability to capture market liquidity events and risk-adjusted returns while maintaining its original price-volume analysis framework.
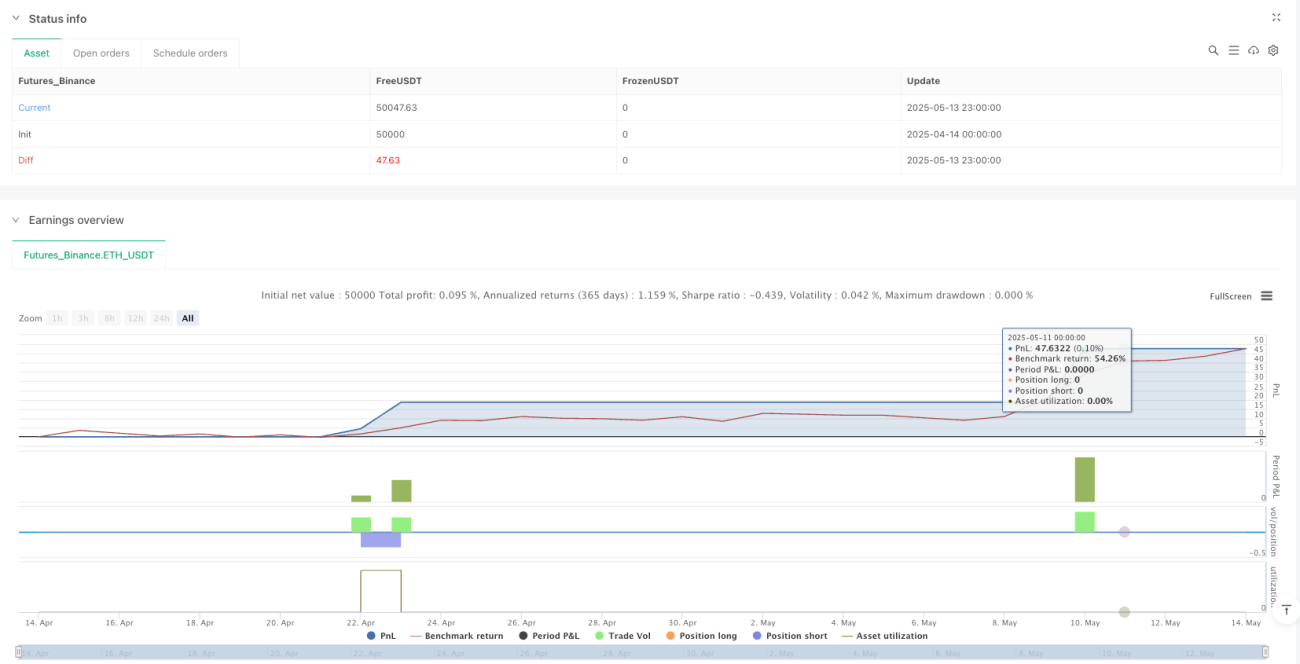
/*backtest
start: 2025-04-14 00:00:00
end: 2025-05-14 00:00:00
period: 3h
basePeriod: 3h
exchanges: [{"eid":"Futures_Binance","currency":"ETH_USDT"}]
*/

//@version=5
strategy("Liquidity Sniper + VWAP Profile", overlay=true, default_qty_type=strategy.percent_of_equity, default_qty_value=1, max_bars_back=500)

// === Inputs ===- 1