Golden Ratio Multi-Confirmation Trend Trading Strategy

Strategy Overview
The Golden Ratio Multi-Confirmation Trend Trading Strategy is a comprehensive trading system that combines multiple technical analysis tools to identify high-probability trading opportunities. This strategy ingeniously integrates moving averages, market structure, fair value gaps, order blocks, candlestick patterns, and Fibonacci extensions to form a complete trading decision framework. The core of the strategy lies in finding the synchronization point between trend direction and multiple technical confirmations, using the 1.618 golden ratio to set precise profit targets, while utilizing key support and resistance levels from market structure to control risk.
Strategy Principles
The operating principle of this strategy is based on a multi-level market analysis framework:
-
Trend Identification: First, the market's main trend is determined through the crossover of 21-period and 55-period Exponential Moving Averages (EMAs). When the fast EMA is above the slow EMA, an uptrend is identified; conversely, a downtrend is recognized.
-
Market Structure Analysis: 5-period Pivot Highs and Pivot Lows are used to identify market swing highs and lows, which serve as stop-loss locations in the strategy.
-
Fair Value Gap (FVG) Identification: The strategy detects gaps between the current candle and the candle from two periods ago. These price gaps typically represent strong buying or selling pressure. An upward gap occurs when the current high is lower than the low from two candles ago; a downward gap is the opposite.
-
Order Block (OB) Confirmation: Potential order concentration areas are identified by analyzing the relationship between the opening and closing prices of two consecutive candles. A bullish order block is defined as the previous candle being bearish (close < open) and the current candle being bullish (close > open); a bearish order block is the opposite.
-
Engulfing Pattern Verification: The classic engulfing pattern is used as the final confirmation for entry signals. A bullish engulfing pattern requires the current candle to be bullish and completely "engulf" the previous bearish candle; a bearish engulfing pattern is the opposite.
-
Fibonacci Target Setting: The 1.618 golden ratio is used to calculate precise profit targets. The long target is calculated as: entry price + (entry price - swing low) × 1.618; the short target is: entry price - (swing high - entry price) × 1.618.
Only when all these conditions are simultaneously met does the strategy trigger a trading signal, greatly improving the reliability and success rate of trades.
Strategy Advantages
Through in-depth analysis of the strategy's code, the following significant advantages can be summarized:
-
Multiple Confirmation Mechanism: By combining trend, market structure, gaps, order blocks, and engulfing patterns, the strategy effectively filters out low-quality signals, only entering positions under high-probability setups.
-
Precise Profit Targets: Using the golden ratio of 1.618, the strategy sets profit targets with a mathematical basis, a ratio widely considered to have natural harmony in financial markets.
-
Clear Risk Management: The strategy uses swing highs and lows from market structure as stop-loss locations, which typically represent important support and resistance levels. If prices break through these levels, the trading rationale is no longer valid.
-
Trend Following: The strategy only trades in the direction of confirmed trends, avoiding the high risk of counter-trend trading. EMA crossovers provide an objective criterion for trend direction.
-
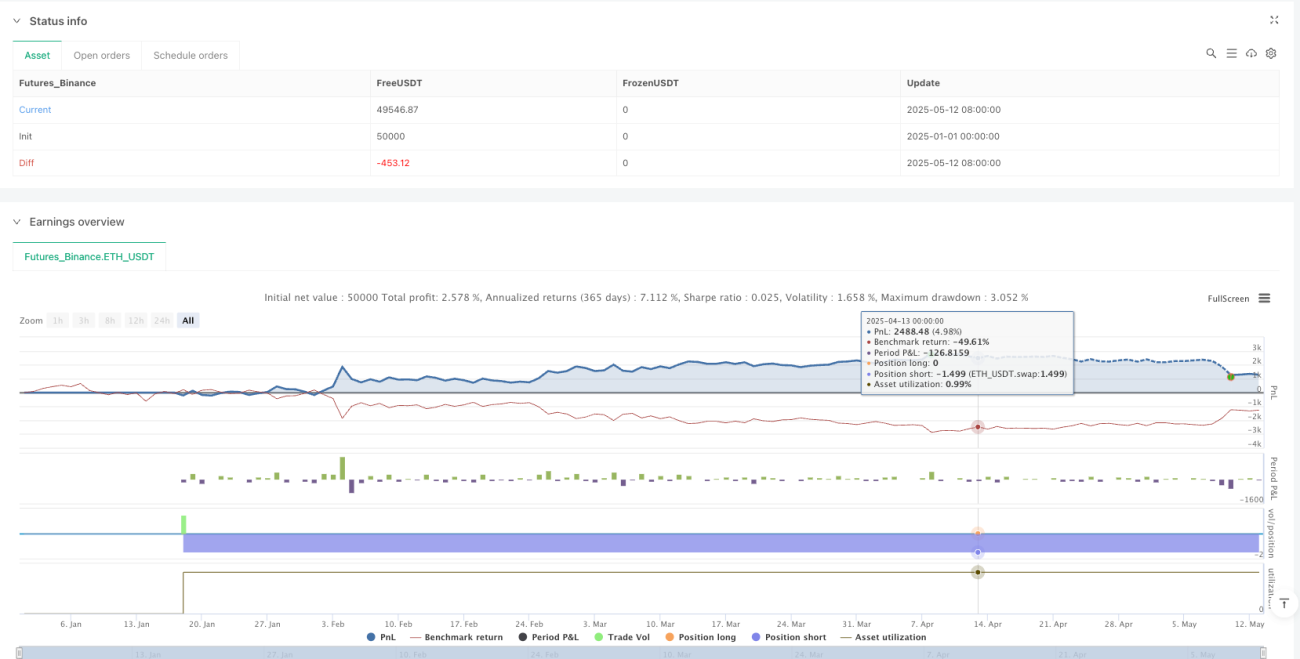
Integrated Fund Management: The strategy defaults to using 10% of account equity for each trade, a percentage allocation method that automatically adjusts position size as the account grows, achieving compound growth.
-
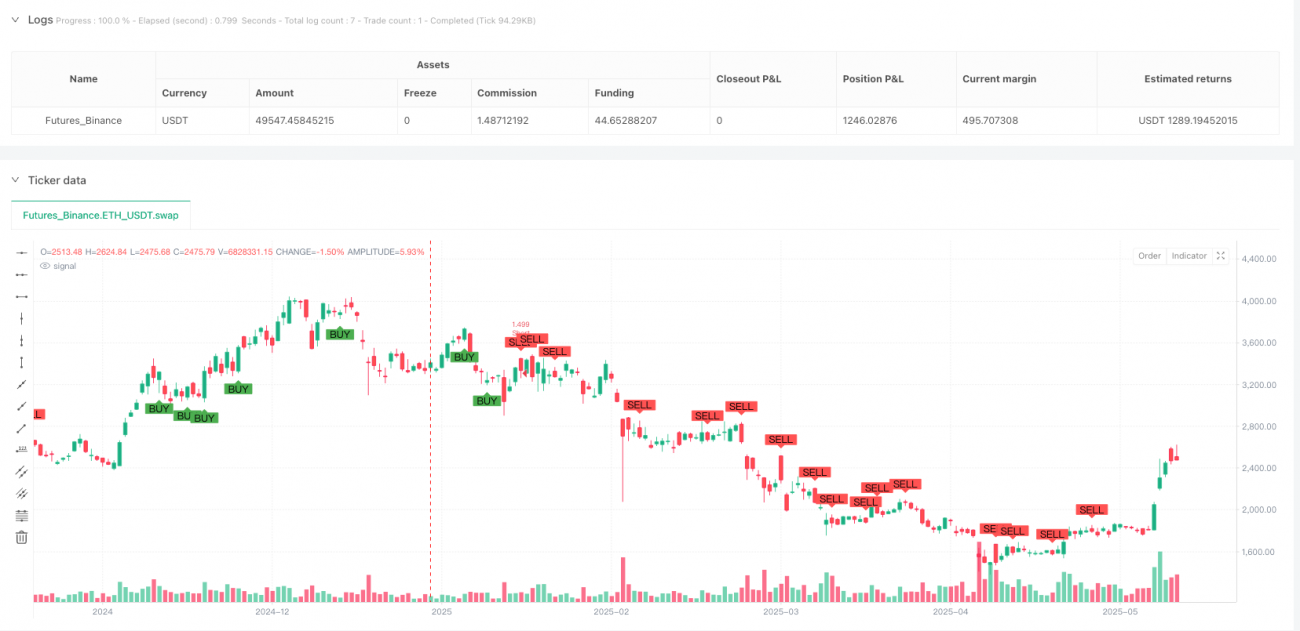
Visualized Trading Signals: By plotting "BUY" and "SELL" labels on the chart, traders can visually identify entry signals, reducing the possibility of subjective judgment.
Strategy Risks
Despite its many advantages, the strategy still has the following risk factors:
-
Scarcity of Trading Opportunities Due to Multiple Conditions: Since the strategy requires multiple conditions to be met to trigger a trading signal, this may lead to relatively few trading opportunities, especially in certain market environments.
-
Potential Risks of Fixed Stop-Loss Positions: Using swing highs and lows as stop-losses may in some cases lead to distant stop-loss positions, increasing the risk amount for each trade.
-
Lagged Response to Trend Reversals: Relying on EMA crossovers to judge trends may result in lagged responses during the initial phases of trend reversals, missing optimal entry points.
-
Lack of Volatility Adjustment Mechanism: The current strategy does not adjust stop-losses and profit targets based on market volatility, which may lead to inconsistent risk/reward ratios in different volatility environments.
-
Potential Over-Optimization Risk: The strategy simultaneously uses multiple parameters and conditions, creating the possibility of over-optimization, which may lead to future performance not matching backtesting results.
To address these risks, traders can consider the following solutions:
- Verify strategy performance across multiple timeframes to ensure its robustness in different market environments
- Introduce adaptive risk management mechanisms, dynamically adjusting stop-loss positions based on volatility indicators like ATR
- Consider adding trend strength filters, only trading in strong trend environments
- Optimize parameters for different markets and timeframes to find the best parameter combinations
Strategy Optimization Directions
Based on an in-depth analysis of the code, the strategy can be optimized in the following directions:
-
Introduce ATR Dynamic Risk Management: Although the ATR variable is defined in the code (atr_len = 14), it is not actually used. ATR can be utilized to dynamically adjust stop-loss positions, for example: sl_long = entry_long - atr_value * 1.5, thus adjusting risk based on market volatility, increasing stop-loss distance in high-volatility markets and reducing it in low-volatility markets.
-
Implement Parameterized Risk-Reward Ratio: The code defines a risk_reward = 2.0 variable but does not use it. This variable can be used to set the risk-reward ratio, for example: tp_long = entry_long + (entry_long - sl_long) * risk_reward, allowing traders to flexibly adjust according to their risk preferences.
-
Add Trend Strength Filter: Introduce ADX or other trend strength indicators, only trading in strong trend environments, for example requiring ADX > 25 to consider trading signals.
-
Add Partial Profit-Taking Mechanism: Consider taking profits on part of the position when reaching partial targets, such as closing 33% of the position at 0.618 and 1.0 targets, and closing the remaining position at the 1.618 target, thus balancing risk and reward.
-
Add Time Filter: Add filtering for market sessions, avoiding sessions with too low or too high volatility, for example not trading during the low-volatility Asian session, or avoiding important news release periods.
-
Integrate Volume Confirmation: Consider adding volume analysis, requiring signals to appear on candles with increased volume, thus increasing the reliability of trading signals.
-
Optimize Parameter Adaptivity: Use adaptive parameters, such as dynamically adjusting EMA periods and Fibonacci ratios based on market conditions, making the strategy more adaptable to different market conditions.
These optimization directions aim to enhance the strategy's robustness, adaptability, and risk management capabilities, enabling it to maintain stable performance in various market environments.
Conclusion
The Golden Ratio Multi-Confirmation Trend Trading Strategy is a well-structured, logically clear comprehensive trading system that achieves high-quality trading signal screening by combining multiple technical analysis tools. The core advantages of the strategy lie in its multiple confirmation mechanism and precise target setting based on the golden ratio, effectively balancing trading frequency and win rate.
By following trend direction, combined with the synergistic confirmation of market structure, gaps, order blocks, and candlestick patterns, the strategy can identify high-probability trading opportunities. At the same time, using natural market structure points for risk control adheres to the basic principles of technical analysis.
Although there are some aspects that can be optimized, such as volatility adjustment, risk management strengthening, and adaptive parameters, the strategy has already formed a complete trading decision framework. Through the optimization directions proposed in this article, traders can further enhance the strategy's adaptability and robustness, maintaining consistent performance in different market environments.
For traders seeking systematized, clearly defined trading methods, this strategy provides a solid foundation that can be further customized and optimized according to individual trading styles and risk preferences.
/*backtest
start: 2025-01-01 00:00:00
end: 2025-05-13 08:00:00
period: 1d
basePeriod: 1d
exchanges: [{"eid":"Futures_Binance","currency":"ETH_USDT"}]
*/

//@version=5
strategy("1.618 Strategy Full System", overlay=true, default_qty_type=strategy.percent_of_equity, default_qty_value=10)

// === SETTINGS ===- 1