Overview
The Dynamic Volatility-Adaptive Trend Crossover Trading System is a quantitative trading strategy that combines a smoothed Exponential Moving Average (EMA) trend filter with a Supertrend confirmation system. This strategy aims to provide high-probability BUY/SELL signals while automatically calculating and displaying Stop Loss and Take Profit levels using the Average True Range (ATR), making trade planning simple, visual, and rule-based. The strategy visually displays entry signals, stop loss/take profit levels, and exit conditions, providing traders with a comprehensive trading system.
Strategy Principle
The core principle of this strategy is based on the synergistic action of two main technical indicators: a smoothed EMA trend line and the Supertrend indicator. The detailed working principle is as follows:
Trend Identification System: The strategy uses a smoothed EMA function (smoothedEma) that combines EMA and SMA to reduce price movement noise. The trend line determines an uptrend (trendUp) or downtrend (trendDn) by comparing the current trend line value with the previous period’s trend line value.
Supertrend Confirmation: The strategy employs the Supertrend indicator as a secondary confirmation tool. The Supertrend indicator calculates upper and lower bands based on ATR and determines trend direction based on the price’s relationship with these bands.
Signal Generation Logic:
- A buy signal (buySignal) is triggered when three conditions are simultaneously met: the trend line is pointing upward (trendUp), there is a trend change (trendChange), and the Supertrend indicates an uptrend (trend_is_up).
- A sell signal (sellSignal) is triggered when the trend line is pointing downward (trendDn), there is a trend change, and the Supertrend does not indicate an uptrend.
Dynamic Risk Management: The strategy uses the ATR multiplied by a factor (atr_mult) to automatically calculate Stop Loss (SL) and Take Profit (TP) levels:
- For long trades: SL is set at a distance below the entry price equal to ATR times the multiplier, and TP is set at the same distance above the entry price.
- For short trades: SL is set at a distance above the entry price equal to ATR times the multiplier, and TP is set at the same distance below the entry price.
Trend Reversal Exits: In addition to SL/TP, the strategy includes additional exit conditions based on trend line crossovers:
- Long positions are closed when the price falls below the trend line and the trend turns downward.
- Short positions are closed when the price breaks above the trend line and the Supertrend indicates an uptrend.
Strategy Advantages
This strategy offers several significant advantages:
Dual Confirmation System: By combining the smoothed EMA trend and the Supertrend indicator, the strategy provides more reliable signals, reducing the risk of false breakouts. This dual filtering approach helps avoid trading in uncertain market conditions.
Dynamic Risk Management: ATR-based stop losses and take profits automatically adapt to market volatility, meaning stop loss levels will be wider in more volatile markets and tighter in less volatile ones. This adaptability makes the strategy suitable for different market environments.
Visual Clarity: The strategy displays stop loss and take profit levels as dashed lines on the chart, allowing traders to see potential risk and reward at a glance. Color-coding of the trend line and Supertrend indicator (green for uptrends, red for downtrends) provides intuitive market direction indication.
Disciplined Trading Framework: With predefined entry and exit rules, the strategy promotes disciplined trading, reducing the impact of emotional decision-making.
Multi-Timeframe Compatibility: The code structure allows the strategy to be used on various timeframes from 5-minute to daily charts, making it suitable for both intraday and swing traders.
Trend Reversal Protection: In addition to the regular stop loss/take profit mechanisms, the strategy includes additional exit conditions based on trend reversals, providing an extra layer of protection against sudden market changes.
Strategy Risks
Despite its many advantages, the strategy also has some potential risks:
Lag Issues: Both the smoothed EMA and Supertrend are lagging indicators, which may lead to delayed entries or exits in rapidly changing markets. This lag can result in suboptimal entry points or missed exit opportunities during trend reversals.
Sideways Market Performance: In market conditions where prices are consolidating or range-bound, the strategy may generate multiple false signals, leading to frequent trades and potential losses. The trend-following nature of the strategy makes it more suitable for clear trending markets.
Parameter Sensitivity: The strategy’s performance is highly dependent on the choice of input parameters (such as trend length, ATR multiplier, and Supertrend factor). Inappropriate parameter settings may lead to over-optimization or poor performance in live trading.
Lack of Market Environment Filtering: The strategy does not have explicit mechanisms to identify and avoid unfavorable market environments, such as periods of extreme volatility or low liquidity, which may increase risk.
Fixed Multiplier Limitations: While the ATR provides volatility adjustment, using a fixed ATR multiplier may not be sufficient for all market conditions. In some cases, the risk-reward ratio may not be favorable enough.
Solutions: - Optimize strategy parameters by backtesting different parameter combinations to find settings that perform robustly across various market conditions. - Consider adding market environment filters, such as volatility thresholds or trend strength indicators, to avoid trading in unfavorable conditions. - Implement a dynamic ATR multiplier that automatically adjusts risk parameters based on market conditions. - Use smaller position sizes in actual trading, especially when market conditions are uncertain.
Strategy Optimization Directions
Based on a deep analysis of the code, here are several potential optimization directions for this strategy:
Add Trend Strength Filter: Integrate the Average Directional Index (ADX) or a similar trend strength indicator to identify strong trends and filter out signals in weak trending environments. This would help reduce false signals in sideways markets, as the strategy would only generate trade signals when the trend is sufficiently strong.
Implement Dynamic ATR Multiplier: Develop a system that automatically adjusts the ATR multiplier based on current market volatility. Using larger multipliers in highly volatile markets and smaller multipliers in low-volatility environments can better balance risk and reward.
Incorporate Volume Confirmation: Add a volume analysis component to ensure that trend changes are accompanied by sufficient volume. This can be implemented by requiring volume to be above average when a trend change occurs, thereby increasing the reliability of signals.
Implement Time Filters: Add a time-based filtering mechanism to avoid trading during known periods of high volatility or low liquidity (such as around market opens or closes). This can reduce poor trades caused by market noise.
Optimize Trend Change Detection: The current trend change detection is relatively simple (trendUp != trendUp[1]). Consider implementing more sophisticated trend change confirmation that requires the trend line’s angle or slope to reach a specific threshold to avoid minor or temporary trend changes triggering trades.
Add Profit Protection Mechanism: Implement a trailing stop feature that automatically adjusts the stop loss level as price moves in a favorable direction to protect realized profits. This can be done through ATR-based trailing stops or moving stops based on the trend line.
Integrate Multi-Timeframe Analysis: Extend the strategy to consider the trend direction on higher timeframes, only taking trades on the lower timeframe when the signal aligns with the higher timeframe trend. This approach can often improve win rates and reduce counter-trend trading.
Backtesting Optimization Framework: Develop a comprehensive backtesting framework to evaluate the strategy’s performance across different market conditions and parameter settings. Use techniques such as Monte Carlo simulation and walk-forward optimization to identify robust parameter sets.
Summary
The Dynamic Volatility-Adaptive Trend Crossover Trading System is a well-designed quantitative trading system that combines a smoothed EMA trend filter with Supertrend confirmation to provide high-probability trading signals with integrated risk management features. Its main strengths lie in its dual confirmation system, ATR-based dynamic risk management, and clear visual feedback, making it an effective tool for traders seeking a rule-oriented approach.
However, the strategy also has some limitations, including the inherent delay of lagging indicators, potential difficulties in sideways markets, and sensitivity to parameter selection. By implementing the suggested optimizations, such as adding trend strength filters, dynamic ATR multipliers, volume confirmation, and multi-timeframe analysis, the strategy’s robustness and performance can be significantly enhanced.
Ultimately, the success of this strategy depends on the trader’s thorough understanding of its underlying principles, appropriate calibration of parameters, and disciplined execution in actual market conditions. By addressing the identified risks and implementing the proposed optimizations, this strategy can become a powerful trading tool across various market environments.
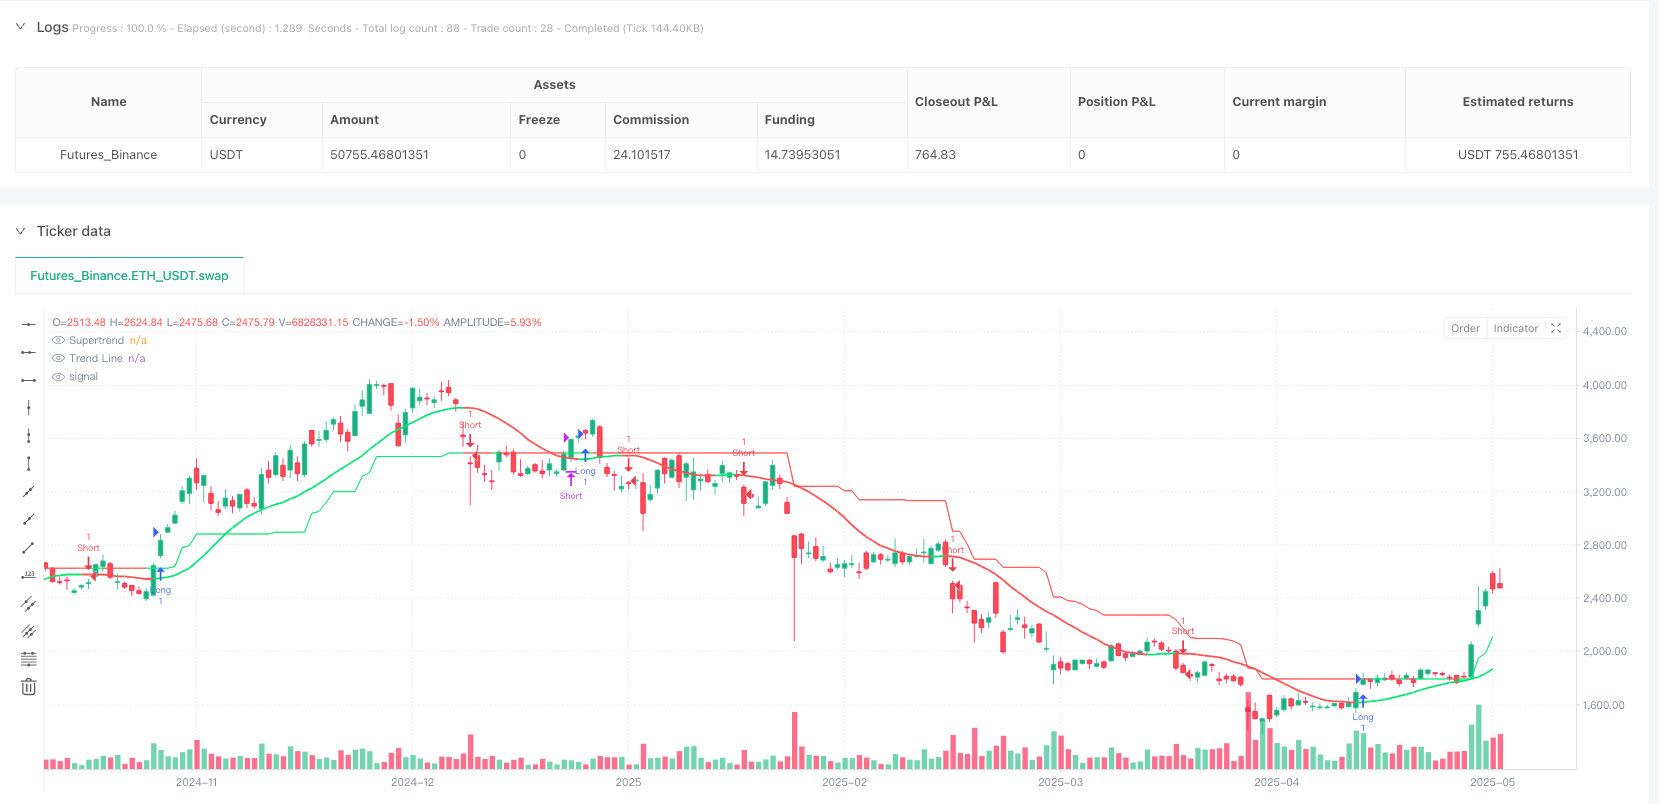
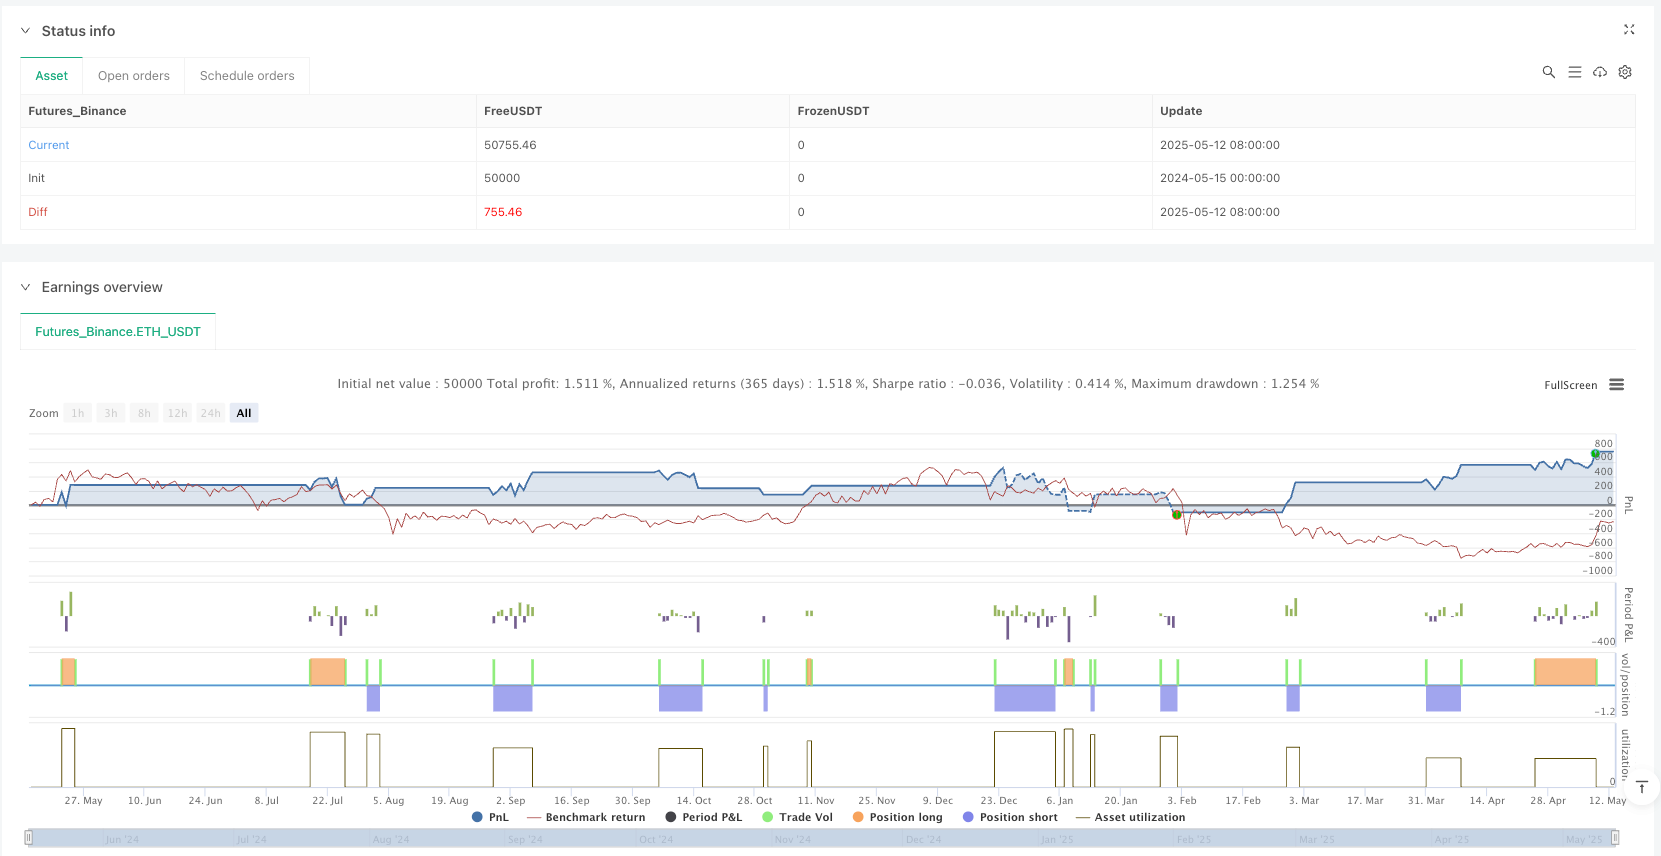
/*backtest
start: 2024-05-15 00:00:00
end: 2025-05-13 08:00:00
period: 1d
basePeriod: 1d
exchanges: [{"eid":"Futures_Binance","currency":"ETH_USDT"}]
*/

// This Pine Script® code is subject to the terms of the Mozilla Public License 2.0 at https://mozilla.org/MPL/2.0/
// © vivekm8955

//@version=6
strategy("Simple Trend Signal with SL/TP", overlay=true)

// === INPUTS ===
length            = input.int(10, "Trend Length")
atr_mult          = input.float(1.5, "ATR Multiplier for SL/TP", step=0.1)
supertrend_factor = input.float(3.0, "Supertrend Factor")
supertrend_period = input.int(10, "Supertrend Period")

// === TREND CALC ===
smoothedEma(src, len) =>
    ta.sma(ta.ema(src, len), len)

trendLine   = smoothedEma(close, length)
trendUp     = trendLine > trendLine[1]
trendDn     = trendLine < trendLine[1]
trendChange = trendUp != trendUp[1]
trendColor  = trendUp ? color.lime : trendDn ? color.red : color.gray

// === SUPER TREND ===
atr        = ta.atr(supertrend_period)
upperband  = (high + low) / 2 + supertrend_factor * atr
lowerband  = (high + low) / 2 - supertrend_factor * atr

var float supertrend = na
var bool trend_is_up = true

if na(supertrend)
    supertrend := close > upperband ? lowerband : upperband
    trend_is_up := close > upperband
else
    if close > supertrend
        supertrend := math.max(lowerband, supertrend)
        trend_is_up := true
    else
        supertrend := math.min(upperband, supertrend)
        trend_is_up := false

// === CONDITIONS ===
buySignal  = trendUp and trendChange and trend_is_up
sellSignal = trendDn and trendChange and not trend_is_up

longSL  = close - atr * atr_mult
longTP  = close + atr * atr_mult
shortSL = close + atr * atr_mult
shortTP = close - atr * atr_mult

// === TREND CROSS EXIT CONDITIONS ===
inLongTrade  = strategy.opentrades > 0 and strategy.opentrades.entry_id(0) == "Long"
inShortTrade = strategy.opentrades > 0 and strategy.opentrades.entry_id(0) == "Short"

exitLongOnTrendCross  = inLongTrade and close < trendLine and trendDn
exitShortOnTrendCross = inShortTrade and close > trendLine and trend_is_up

// === STRATEGY EXECUTION ===
if (buySignal)
    strategy.entry("Long", strategy.long, comment="BUY")
    strategy.exit("Long Exit", from_entry="Long", stop=longSL, limit=longTP)

if (sellSignal)
    strategy.entry("Short", strategy.short, comment="SELL")
    strategy.exit("Short Exit", from_entry="Short", stop=shortSL, limit=shortTP)

// Immediate Exit Conditions
if (exitLongOnTrendCross)
    strategy.close("Long", comment="Exit Long: Crossed Below Trend Line")

if (exitShortOnTrendCross)
    strategy.close("Short", comment="Exit Short: Crossed Above Trend Line")

// === PLOTS ===
plot(trendLine, "Trend Line", color=trendColor, linewidth=2)
plot(supertrend, "Supertrend", color=trend_is_up ? color.lime : color.red)