
Overview
The EMA-RSI Trend-Momentum Candlestick Pattern Quantitative Strategy is a comprehensive trading system that combines technical indicators with candlestick pattern recognition. This strategy operates primarily on the 15-minute timeframe, using the 200-period Exponential Moving Average (EMA) to determine market trend direction, the Relative Strength Index (RSI) to confirm price momentum, and incorporating classic candlestick patterns like engulfing and pin bars for entry signals. The strategy employs a risk-reward based profit target setting, achieving a perfect blend of trend following and price action analysis.
Strategy Principles
The core principles of this strategy are based on a combination of trend following and price action analysis. The specific logic is as follows:
-
Trend Identification: The 200-period EMA serves as the primary trend filter. When price is above the EMA, the market is determined to be in an uptrend; when price is below the EMA, the market is considered to be in a downtrend.
-
Momentum Confirmation: The RSI indicator is used to assess price momentum. The strategy sets an upper threshold of 55 and a lower threshold of 45. For long conditions, RSI must be below 55, indicating the price is not overbought; for short conditions, RSI must be above 45, indicating the price is not oversold.
-
Entry Signals: Classic candlestick patterns serve as precise entry points:
- Long Entry: When price is above 200 EMA, RSI is below 55, and either a bullish engulfing pattern or bullish pin bar appears
- Short Entry: When price is below 200 EMA, RSI is above 45, and either a bearish engulfing pattern or bearish pin bar appears
-
Risk Management: Combines fixed stop-loss points with dynamic profit targets:
- Stop-Loss: Calculated based on input pips
- Profit Target: Calculated based on risk-reward ratio, default being 2x the risk distance
Strategy Advantages
-
Multiple Confirmation Mechanism: The strategy incorporates a triple confirmation mechanism of trend, momentum, and price patterns, significantly reducing false signals and improving trade success rates. When all three conditions are met simultaneously, the reliability of the entry signal is greatly enhanced.
-
Strong Adaptability: The strategy is applicable to various trading instruments, including forex, cryptocurrencies, and stocks, and is optimized for 15-minute charts, providing a good balance between trading frequency and signal quality.
-
Comprehensive Risk Management: The dynamic profit target setting based on risk-reward ratio ensures consistent risk-reward proportions for each trade, which is conducive to long-term stable profitability.
-
Avoids Counter-Trend Trading: Through the 200 EMA trend filter, the strategy strictly avoids counter-trend trading, only trading in the direction of the trend, enhancing the overall stability of the system.
-
Strong Backtesting Capability: The strategy code has a clear structure with flexible parameter settings, making it easy to conduct historical backtesting and parameter optimization, and is compatible with PineConnector for algorithmic automated trading.
Strategy Risks
-
Over-reliance on Technical Indicators: This strategy primarily depends on technical indicators and price patterns, which may fail during sharp market fluctuations or significant fundamental events. The solution is to pause trading during important data releases or abnormal market volatility.
-
Parameter Sensitivity: Strategy performance is sensitive to parameter settings such as RSI thresholds and EMA periods, which may require different parameters in different market environments. It is recommended to optimize parameters for different trading instruments and market conditions through historical backtesting.
-
False Breakout Risk: In range-bound markets, prices may frequently cross the 200 EMA, generating false signals. Consider adding volume confirmation or expanding filter conditions to reduce false signals.
-
Fixed Stop-Loss Risk: Using fixed pips for stop-loss may not adapt to all market volatility conditions – it might be too small in high-volatility markets or too large in low-volatility markets. Consider using dynamic stop-loss methods based on ATR or key price levels.
-
Mechanical Candlestick Pattern Recognition: The candlestick pattern recognition in the code uses a simplified algorithm that may not capture all valid patterns or may misidentify invalid ones. Consider introducing more complex pattern recognition algorithms or adding additional confirmation conditions.
Optimization Directions
-
Dynamic Parameter Adjustment: Introduce adaptive parameter mechanisms to automatically adjust RSI thresholds and EMA periods based on market volatility. For example, increase RSI filtering range when volatility increases, and shorten EMA periods when trends are obvious. This allows the strategy to better adapt to different market environments.
-
Add Time Filtering: Implement trading time filters to avoid low liquidity and high volatility periods, such as market opening and closing sessions. This helps avoid erroneous signals during periods of high market noise.
-
Multi-timeframe Confirmation: Add trend confirmation from higher timeframes, such as confirming trend direction on the daily chart before looking for entry signals on the 15-minute chart. Multi-timeframe confirmation can increase signal reliability and reduce counter-trend trading risk.
-
Improve Stop-Loss Strategy: Replace fixed pip stop-losses with ATR or volatility percentage to better adapt to actual market fluctuations. Dynamic stop-losses can better protect capital and avoid excessive losses due to sudden market volatility.
-
Incorporate Volume Analysis: Combining candlestick patterns with volume confirmation can improve signal quality. Patterns supported by high volume typically have higher reliability and can effectively filter out some false signals.
Summary
The EMA-RSI Trend-Momentum Candlestick Pattern Quantitative Strategy is a comprehensive trading system that combines trend following, momentum analysis, and price pattern recognition. By using the 200 EMA for trend filtering, RSI for momentum confirmation, and classic candlestick patterns for precise entry points, this strategy provides a systematic approach to market analysis and trade execution.
The main advantages of this strategy lie in its multiple confirmation mechanisms and comprehensive risk management, though it also faces risks such as strong dependence on technical indicators and high parameter sensitivity. Through the introduction of dynamic parameter adjustments, multi-timeframe confirmation, and improved stop-loss strategies, the stability and adaptability of the strategy can be further enhanced.
Overall, this is a well-designed quantitative trading strategy with clear logic, suitable for medium to long-term trend traders. With proper parameter settings and risk control, this strategy has the potential to achieve stable performance across various market environments.
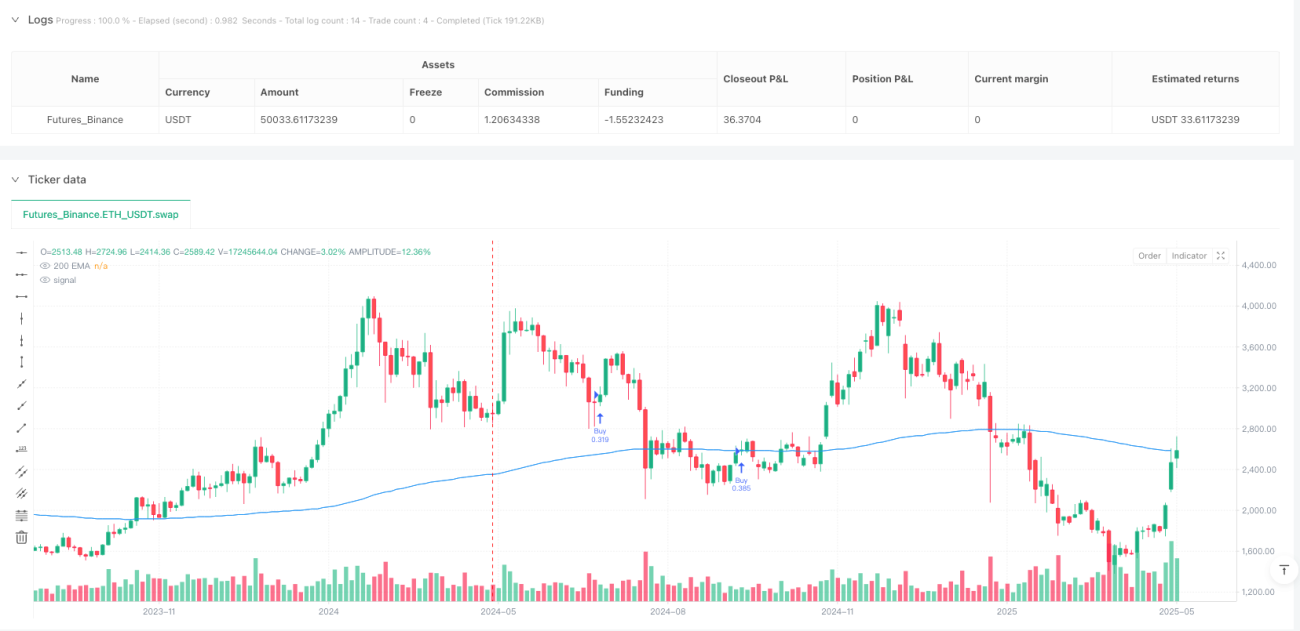
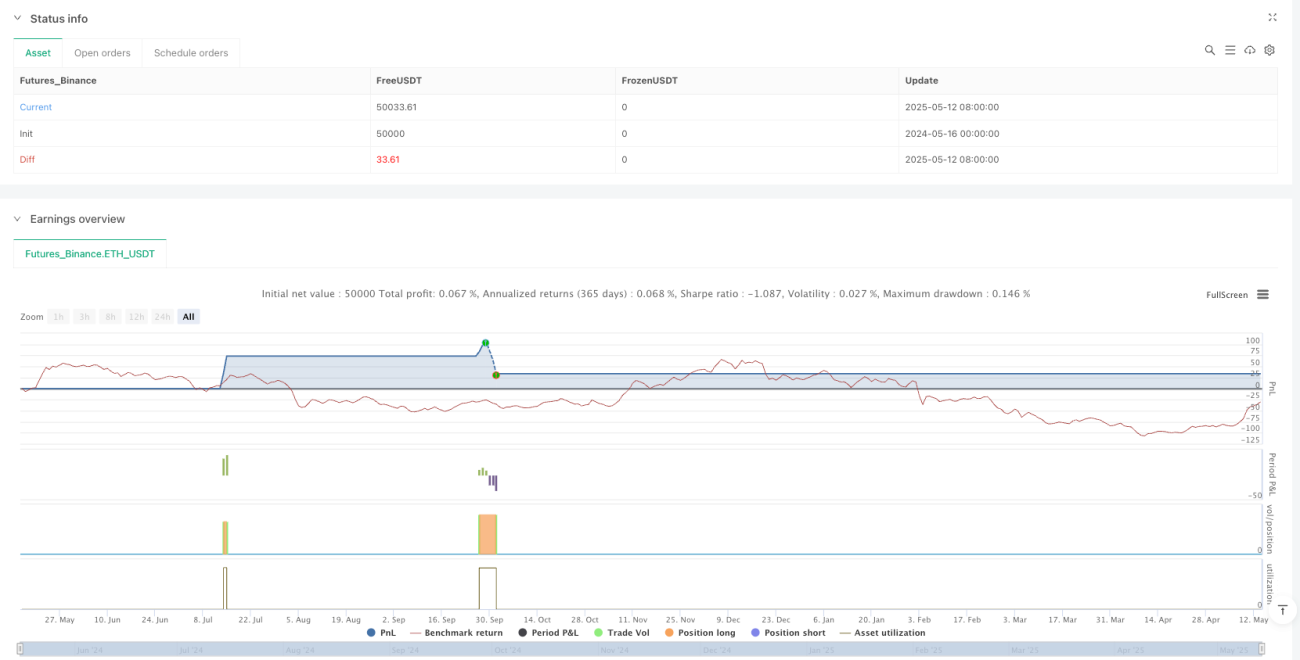
/*backtest
start: 2024-05-16 00:00:00
end: 2025-05-14 08:00:00
period: 3d
basePeriod: 3d
exchanges: [{"eid":"Futures_Binance","currency":"ETH_USDT"}]
*/

//@version=5
strategy("15-Min Candlestick Strategy", overlay=true, default_qty_type=strategy.percent_of_equity, default_qty_value=2)

// === INPUTS ===- 1