Dynamic Gap-Fill Mean Reversion Strategy: Trend & Volume Filters

Overview
The Dynamic Gap-Fill Mean Reversion Strategy is a quantitative trading system specifically designed to target intraday gap-fill phenomena. The strategy is based on the natural tendency of markets to revert and fill significant gaps that occur. Operating on a 3-minute timeframe, the system utilizes specific price patterns, trend direction, and volume confirmation to filter high-probability trading opportunities. The system employs mean reversion principles and enhances trade success rate through multiple filters, including EMA trend filtering, volume confirmation, and RSI overbought filtering.
Strategy Principles
The core logic of the strategy revolves around gap detection and filling:
-
Gap Detection Mechanism: The strategy first identifies intraday price gaps exceeding 0.5%. By comparing the previous trading day's closing price with today's opening price, it determines whether there is an upward or downward gap.
-
Trend Confirmation: Using 50-period and 200-period Exponential Moving Averages (EMA) to determine the current market trend. Long trades are only considered when EMA50 is greater than EMA200; short trades are only considered when EMA50 is less than EMA200.
-
Three-Candle Reversal Pattern: The strategy requires three consecutive candles to form a reversal pattern. For longs, an ascending pattern of close[2] < close[1] < close is needed; for shorts, a descending pattern of close[2] > close[1] > close is required.
-
Volume Filtering: An optional volume filter ensures trades are only taken when volume is above the 20-period average, adding reliability to the signals.
-
RSI Filtering: For short trades, an additional condition of RSI > 60 is added, ensuring the market is in a relatively overbought state, improving the quality of short signals.
Entry conditions combine all the above factors:
- Long: Gap down + Three-candle up pattern + Volume confirmation + Uptrend
- Short: Gap up + Three-candle down pattern + Volume confirmation + Downtrend + RSI overbought
Strategy Advantages
-
Clear Market Anomaly Identification: The strategy focuses on a specific market anomaly—price gaps—which is a statistically significant market phenomenon providing a predictive edge.
-
Multiple Confirmation Mechanisms: By combining gaps, trend filtering, volume confirmation, and price patterns, the strategy significantly reduces the possibility of false signals.
-
Precise Risk Management: Uses ATR to set stop losses and profit targets, ensuring risk management adapts to changes in market volatility. A maximum dollar stop loss amount is set, effectively controlling risk exposure per trade.
-
Dynamic Trailing Stop: Once a trade reaches a 2×ATR profit level, a trailing stop can be activated, allowing profitable trades to continue running while securing a portion of the profits.
-
Flexible Parameter Settings: The strategy offers multiple adjustable parameters (gap size, ATR multipliers, maximum stop loss amount, etc.) that can be optimized according to the trader's risk preferences and market conditions.
-
Time Limit Protection: By setting a maximum holding time (50 bars), the strategy prevents trades from remaining in a losing position for extended periods, optimizing capital efficiency.
-
Alignment with Market Microstructure: The strategy design aligns with market microstructure, focusing on intraday trading and avoiding overnight risk.
Strategy Risks
-
Moderate Win Rate: The strategy's approximately 46% win rate means slightly more losing trades than winning ones. While profitable overall, this may require good psychological resilience during consecutive loss periods.
-
Market Dependency: The strategy explicitly states it's only suitable for NASDAQ (US100) 3-minute charts, not tested or optimized for other assets or timeframes. This limits the strategy's application range.
-
Parameter Sensitivity: Like most quantitative strategies, performance may be highly sensitive to parameter selection. Over-optimization might lead to backtest performance that doesn't translate well to live trading.
-
Limited Trading Frequency: Executing only one trade per day limits profit potential, especially on days with lower volatility where other opportunities might be missed.
-
Gap Occurrence Frequency Risk: The strategy relies on the occurrence of gaps of a specific size, which might lead to extended periods without trading signals during calm market periods.
-
Strategy Decay Risk: As more traders employ similar strategies, the gap-filling effect may diminish, leading to reduced strategy efficiency.
Mitigation Measures:
- Implement strict money management, risking no more than 1-2% of account per trade
- Regularly revalidate and optimize strategy parameters
- Consider adjusting gap thresholds under different market conditions
- Allow sufficient time to monitor strategy performance in live trading
Strategy Optimization Directions
-
Enhanced Trend Filtering: The current strategy uses simple EMA crossovers as trend indicators. Consider integrating more sophisticated trend identification methods, such as ADX (Average Directional Index) or multi-timeframe trend analysis, to improve filtering quality.
-
Optimized Entry Timing: The current three-candle reversal pattern may be overly simplistic. Consider adding technical confirmations such as candlestick formations, support/resistance levels, or price action analysis to optimize entry timing.
-
Dynamic Stop-Loss and Take-Profit Targets: While using fixed ATR multipliers is reasonable, implementing dynamic adjustments based on market volatility or intraday timing could be beneficial. For example, increasing ATR multipliers during high volatility periods or adjusting risk parameters based on the trading session.
-
Machine Learning Enhancement: Analyzing historical gap-fill success rate features (such as gap size, market conditions, timing, etc.) through machine learning models could potentially further improve strategy performance.
-
Increased Trading Frequency: Consider modifying the strategy to allow multiple trades within the same trading day, especially when a previous trade has concluded and a new valid signal appears. This may increase overall returns but should be tested carefully to ensure it doesn't introduce overtrading.
-
Related Market Signal Integration: Consider integrating signals from related markets (such as futures, ETFs, or related sector indices) as confirmations. This may provide additional informational edge, especially in determining whether a gap will be filled.
-
Time-Based Filtering: Markets may behave differently during different time periods. Adding filters based on trading time might enhance strategy performance, such as avoiding high-volatility periods at market open and close.
Summary
The Dynamic Gap-Fill Mean Reversion Strategy is a carefully designed intraday trading system focused on exploiting the statistical tendency of markets to revert and fill gaps. The strategy combines gap detection, trend confirmation, volume filtering, and price pattern recognition to create a multi-layered trading decision framework.
The core strengths of the strategy lie in its clearly defined entry rules, ATR-based risk management, and multiple confirmation mechanisms. Despite a moderate win rate (approximately 46%), the strategy manages to generate positive returns in backtesting through precise risk-reward settings (2:1 risk-reward ratio).
The strategy is particularly suitable for traders seeking to capitalize on specific market anomalies, especially those interested in intraday NASDAQ trading. However, potential users should be aware of the strategy's limitations, including market dependency and parameter sensitivity.
By implementing the suggested optimization measures, particularly enhancing trend filters and improving entry timing, the strategy could potentially further improve its performance and robustness. As market conditions change, regular reassessment and adjustment of parameters will be key to maintaining long-term success.
Ultimately, this strategy represents a balanced quantitative trading approach, combining technical analysis and statistical concepts to capture specific behavioral patterns in the market in a systematic way.
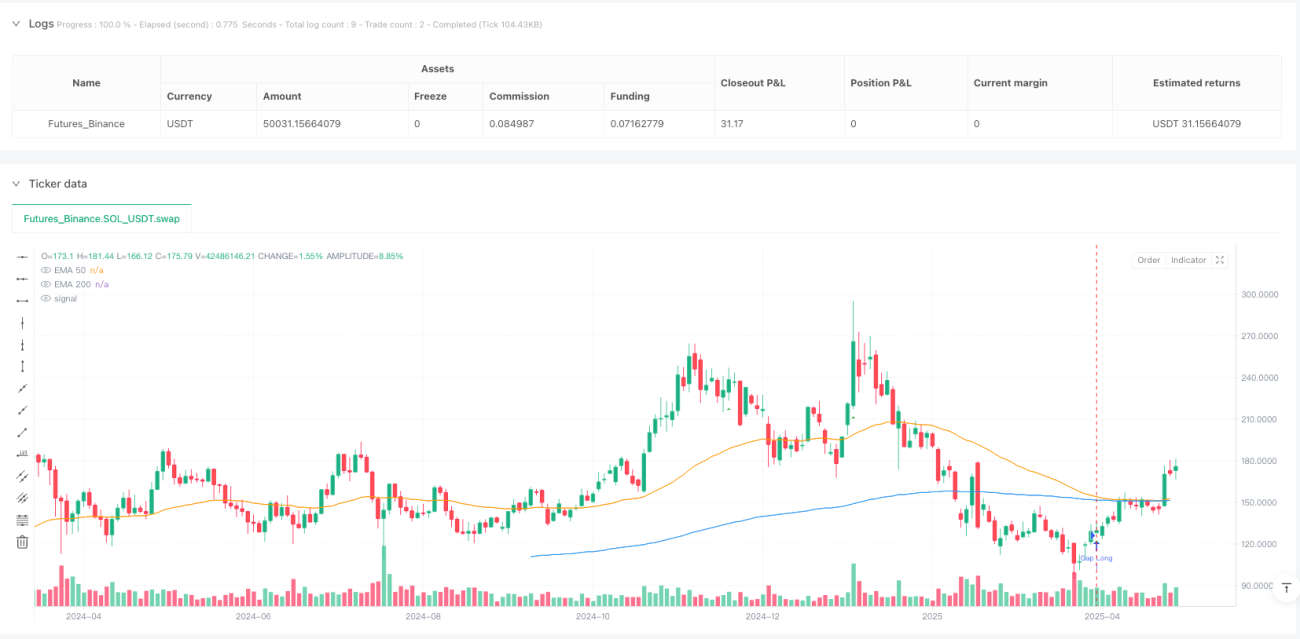
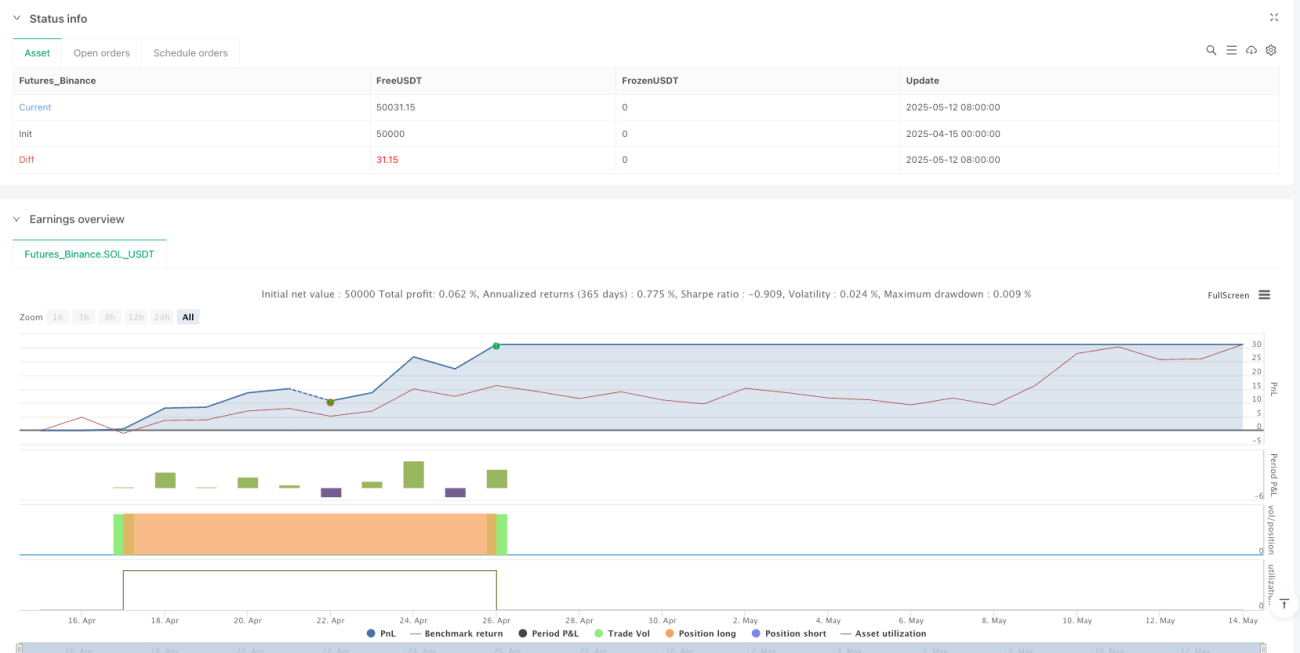
/*backtest
start: 2025-04-15 00:00:00
end: 2025-05-14 08:00:00
period: 2d
basePeriod: 2d
exchanges: [{"eid":"Futures_Binance","currency":"SOL_USDT"}]
*/

//@version=5
strategy("Gap Fill Mean Reversion Strategy – NASDAQ 3-Minute", overlay=true, default_qty_type=strategy.fixed, default_qty_value=1)

// === INPUTS ===- 1