Multi-Indicator Trend Reversal Strategy with ATR Dynamic Risk Management System

Overview
The Multi-Indicator Trend Reversal Strategy with ATR Dynamic Risk Management System is a quantitative trading strategy that combines multiple technical indicators to capture trading opportunities by identifying market trend reversal signals. This strategy utilizes classic indicators such as RSI, MACD, volume, and moving averages for multi-dimensional analysis, while dynamically setting stop-loss and profit targets through the ATR volatility indicator to achieve scientific risk management and profit maximization. Notably, the strategy visually displays entry price, stop-loss level, and two target profit levels on the chart, allowing traders to clearly grasp the risk-reward ratio of each trade.
Strategy Principles
The core principle of this strategy is to accurately capture market trend reversal points through multi-indicator confirmation while employing a volatility-based dynamic risk management approach. Specifically:
-
Entry Signal Generation Mechanism:
- Long Entry Conditions: RSI greater than 30 (leaving oversold territory), MACD histogram positive (bullish momentum shift), volume greater than volume moving average (volume confirmation), closing price above 50-day moving average (uptrend confirmation)
- Short Entry Conditions: RSI less than 70 (leaving overbought territory), MACD histogram negative (bearish momentum shift), volume greater than volume moving average (volume confirmation), closing price below 50-day moving average (downtrend confirmation)
-
Risk Management Mechanism:
- Dynamic stop-loss setting based on ATR: Using an ATR multiplier (default 1.0) to calculate stop-loss distance, automatically adapting to market volatility
- Tiered profit strategy: Setting two target profit levels (TP1 and TP2), based on different ATR multipliers (default 1.5 and 2.5)
- Partial profit mechanism: Closing 50% of position at the first target (TP1), and remaining position at the second target (TP2)
-
Visualization System:
- Dynamic display of entry price, stop-loss level, and target profit levels, helping traders visually assess risk-reward ratio
- Visual cues for trading signals, including buy/sell labels and background color changes
- Alert functionality to notify users when trading signals are triggered
Strategy Advantages
-
Multi-dimensional Confirmation Mechanism: The strategy combines momentum indicators (RSI, MACD), volume analysis, and trend indicators (SMA), forming a comprehensive market perspective that greatly reduces false breakout signals and improves entry accuracy.
-
Adaptive Risk Management: By dynamically adjusting stop-loss and target levels through ATR, the strategy can intelligently adapt to volatility characteristics in different market environments, automatically widening stop-loss ranges in high-volatility markets and tightening them in low-volatility markets.
-
Tiered Profit Mechanism: The two-level target profit design allows for securing partial profits at the first target level, reducing drawdown risk, while retaining partial position to maximize potential gains from trending markets.
-
Intuitive Visualization Interface: Traders can clearly see entry points, stop-loss points, and target profit points, helping them quickly assess risk-reward ratios and enhancing trading discipline and confidence.
-
Alert System: The built-in alert functionality allows traders to avoid constant chart monitoring, improving the strategy's practicality and user experience.
Strategy Risks
-
Indicator Lag Risk: The technical indicators used in the strategy, such as RSI, MACD, and moving averages, are inherently lagging indicators that may cause delayed entry signals in rapidly changing markets, missing optimal entry points or generating signals only after trend reversals.
-
Overtrading Risk: Multiple indicator combinations may produce frequent crossover signals in sideways, consolidating markets, leading to overtrading and commission erosion.
-
Parameter Sensitivity: Strategy performance is highly dependent on user input parameter settings, with optimal parameters varying significantly across different market environments. Improper parameter settings may significantly affect strategy performance.
-
Volatility Traps: Stop-loss and profit targets based on ATR may not be flexible enough during volatility shifts (such as before and after major news releases), resulting in stop-loss ranges that are either too wide or too narrow.
-
Backtesting vs. Real-Trading Discrepancy: Good strategy performance in backtesting does not guarantee the same excellence in real trading, especially considering factors such as slippage and trading delays.
Solutions:
- Incorporate more leading indicators (such as price patterns, support/resistance levels) to identify potential reversals earlier
- Add market environment filters to pause trading in inefficient market conditions
- Establish parameter optimization systems to periodically adjust parameters based on market conditions
- Introduce volatility anomaly detection mechanisms to pause the strategy or adjust ATR multipliers during abnormal volatility
- Adopt more conservative position management in live trading, gradually validating strategy effectiveness
Strategy Optimization Directions
-
Market Environment Classification and Adaptive Parameters: The current strategy uses the same parameter settings across all market environments. Consider introducing a market environment classification mechanism (such as volatility grading, trend strength assessment) to automatically switch to optimal parameter combinations in different market environments. This would better adapt to market cyclical changes and improve strategy robustness.
-
Improved Entry Conditions: Entry signal quality can be enhanced by adding price pattern recognition, support/resistance breakout confirmation, and other filtering conditions. For example, incorporating Bollinger Bands and Fibonacci retracements to confirm support/resistance relationships at potential reversal positions can reduce false signals.
-
Intelligent Stop-Loss Management: The current fixed ATR multiplier can be upgraded to a dynamic adjustment mechanism, adjusting the ATR multiplier automatically based on historical volatility percentiles, market trend strength, or trading time periods for more refined risk control.
-
Enhanced Profit Strategy: Consider implementing more complex segmented profit-taking and dynamic trailing stop strategies, such as automatically adjusting the second target level when trends strengthen, or activating trailing stops when breaking key levels to maximize returns from major trend movements.
-
Time Filters: Introduce time dimension analysis, such as avoiding major economic data release periods, paying special attention to quarter transition periods with abnormal volatility, or identifying the most active trading sessions during the day to improve trading efficiency.
-
Backtesting Methodology Improvements: Add advanced backtesting methods such as Monte Carlo simulation testing and walk-forward optimization analysis to more comprehensively evaluate strategy performance stability across different market environments and establish healthier expectations.
Summary
The Multi-Indicator Trend Reversal Strategy with ATR Dynamic Risk Management System is a comprehensive trading system that integrates multiple classic technical analysis methods. Through the collaborative confirmation of RSI, MACD, volume, and moving averages, it effectively identifies market trend reversal opportunities. The strategy's greatest feature is its ATR-based dynamic risk management system, which achieves automatic adjustment of stop-loss and target profit levels, allowing the strategy to adapt to volatility characteristics across different market environments.
The strategy's tiered profit mechanism ensures timely securing of partial profits while retaining the potential to follow major trends, reflecting a balanced risk management philosophy. The intuitive visualization interface and alert system greatly enhance the strategy's practicality and user experience. Although the strategy still faces potential risks such as indicator lag and parameter sensitivity, through the suggested optimization directions—such as market environment classification, intelligent stop-loss management, and time filters—its robustness and adaptability can be further enhanced.
Overall, this is a well-structured, logically rigorous quantitative trading strategy suitable for investors seeking to implement systematic, disciplined trading based on technical analysis. The strategy's modular design also provides convenience for subsequent personalized adjustments and deep optimization. Through continuous improvement and practical validation, this strategy has the potential to become a powerful weapon in a trader's toolkit.
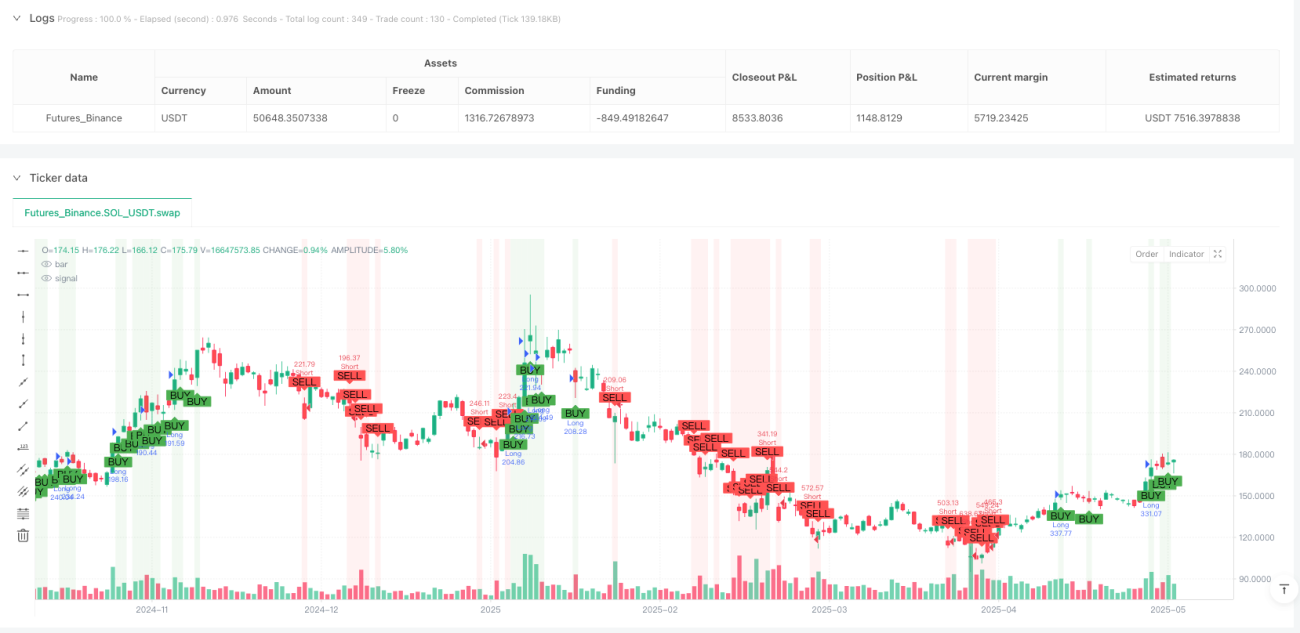
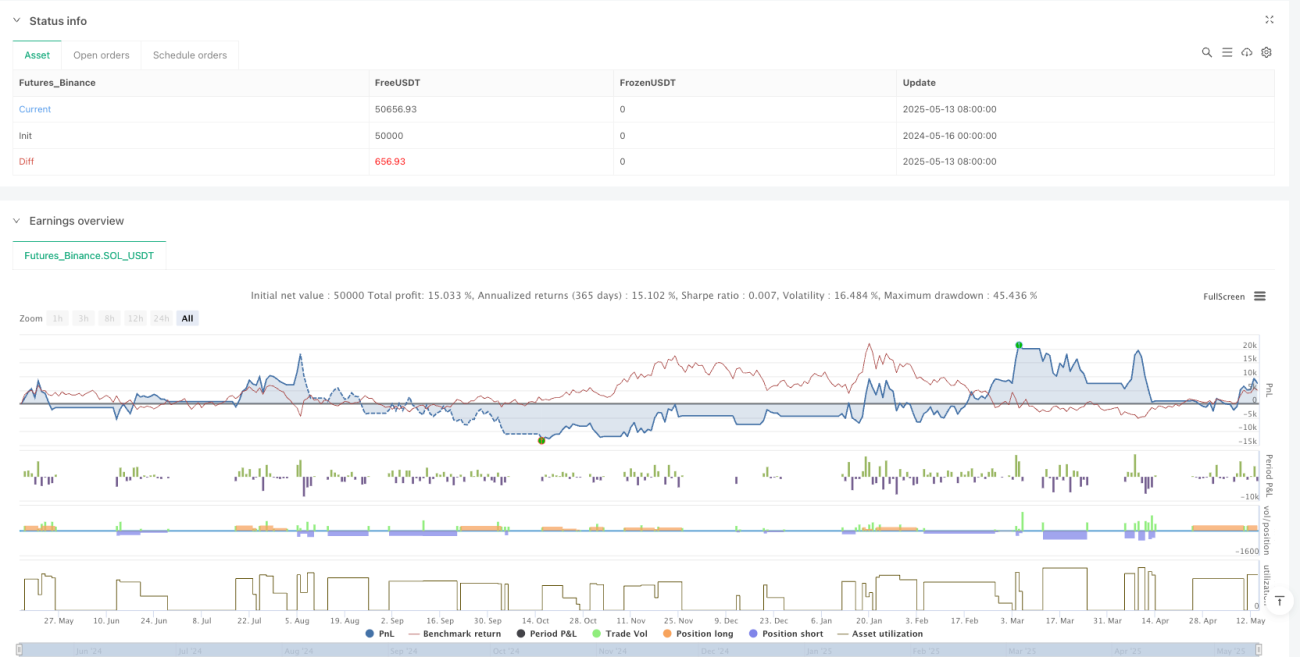
/*backtest
start: 2024-05-16 00:00:00
end: 2025-05-14 08:00:00
period: 1d
basePeriod: 1d
exchanges: [{"eid":"Futures_Binance","currency":"SOL_USDT"}]
*/

//@version=5
strategy("🔥 Smart Trend Reversal PRO (Stable TP/SL Visuals)", overlay=true, default_qty_type=strategy.percent_of_equity, default_qty_value=100)

// === USER INPUT ===- 1