
Overview
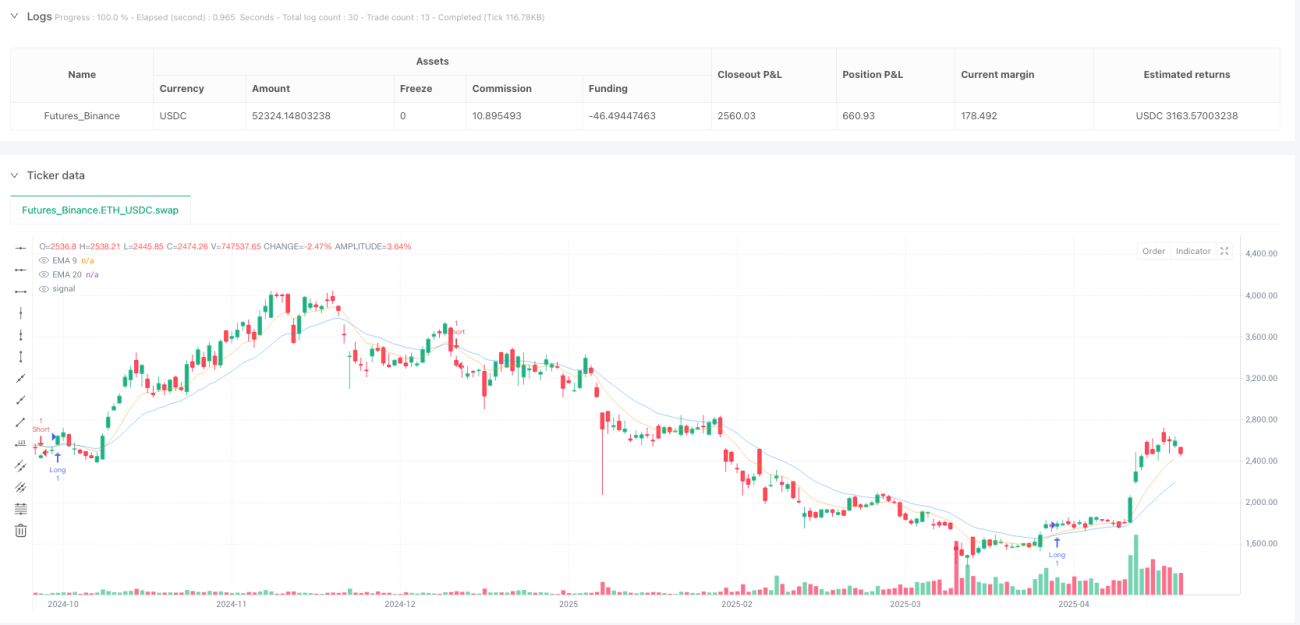
The EMA-RSI Trend Reversal Quantitative Trading System is a quantitative trading strategy that combines Exponential Moving Averages (EMA) and the Relative Strength Index (RSI). This strategy primarily identifies market trend reversal points by detecting crossovers between EMA9 and EMA20, combined with RSI breakouts from specific zones. The system performs excellently during trend reversal phases, effectively identifying when market direction is changing.
Strategy Principles
The core principle of this strategy lies in combining the advantages of two classic technical analysis indicators: EMAs smooth price fluctuations and reflect medium to short-term trend directions, while RSI measures market overbought and oversold conditions. The specific logic works as follows:
- Uses 9-period and 20-period Exponential Moving Averages (EMA9 and EMA20) to determine trend direction
- Uses 14-period Relative Strength Index (RSI) to confirm market conditions
- Buy signal conditions:
- RSI breaks above the 55 level from below (confirming upward momentum)
- EMA9 crosses above EMA20 (confirming short-term average crossing above longer-term average)
- Sell signal conditions:
- RSI breaks below the 45 level from above (confirming downward momentum)
- EMA9 crosses below EMA20 (confirming short-term average crossing below longer-term average)
The strategy ensures that signals are only triggered when both conditions are met simultaneously, creating a multi-confirmation mechanism that effectively reduces false signals and improves trading accuracy.
Strategy Advantages
-
Multi-indicator confirmation mechanism: By combining EMA crossovers and RSI breakouts, a dual confirmation system is formed, significantly reducing the probability of false signals.
-
Trend reversal identification capability: The strategy focuses on capturing market trend turning points, which typically represent moments with the greatest profit potential in the market.
-
Rational parameter selection: The EMA parameters (9 and 20) and RSI parameter (14) are classic and time-tested settings in technical analysis, with solid theoretical foundations.
-
Visually friendly interface: The strategy uses triangular markers with different colors and transparency levels to visually display trading signals, including detailed shadow effects, enhancing user experience.
-
Clear and concise logic: The strategy rules are clear, simple to understand and execute, without complex parameter adjustment requirements.
Strategy Risks
-
Oscillation risk in trending markets: In strongly trending markets, RSI may remain in overbought or oversold territories for extended periods, resulting in sparse signals or frequent false signals. The solution is to add trend filters or adjust RSI thresholds during clearly defined trend periods.
-
Rapid market reversal risk: In violently fluctuating markets, prices may reverse quickly, causing the system to miss turning points. Adding stop-loss mechanisms is recommended to control such risks.
-
Parameter sensitivity: Fixed EMA and RSI parameters may not be suitable for all market conditions and timeframes. Consider dynamically adjusting parameters based on different instruments and market environments.
-
Lack of profit-taking and stop-loss mechanisms: The current strategy lacks explicit profit-taking and stop-loss rules, which could lead to continued losses in unfavorable market conditions or failure to lock in profits. The solution is to implement appropriate money management and risk control rules.
-
False breakout risk: After RSI breaks through the 55 or 45 level, it may quickly retrace, leading to false signals. This can be addressed by adding confirmation periods or combining with other indicators to filter these false breakouts.
Strategy Optimization Directions
-
Add time filters: Add filters based on market trading sessions to avoid trading during low liquidity or high volatility periods. This is because markets exhibit different characteristics during different sessions, with some periods more prone to generating false signals.
-
Dynamic RSI thresholds: Consider automatically adjusting RSI threshold levels based on market volatility, using wider threshold ranges in high-volatility markets and narrower ranges in low-volatility markets. This allows better adaptation to different market environments.
-
Incorporate volume confirmation: Combining volume indicators can improve signal reliability, especially at trend reversal points, as effective reversals are typically accompanied by significant volume changes.
-
Implement complete money management system: Add fixed percentage risk, dynamic position sizing calculations, and compound stop-loss mechanisms to protect capital and optimize returns.
-
Add trend strength filters: Include trend strength indicators like ADX, executing trades only when trends are sufficiently developed to avoid frequent trading in ranging markets.
-
Explore signal combinations across different timeframes: Consider multi-timeframe analysis, combining trend direction from longer timeframes with entry signals from shorter timeframes to improve overall accuracy.
Conclusion
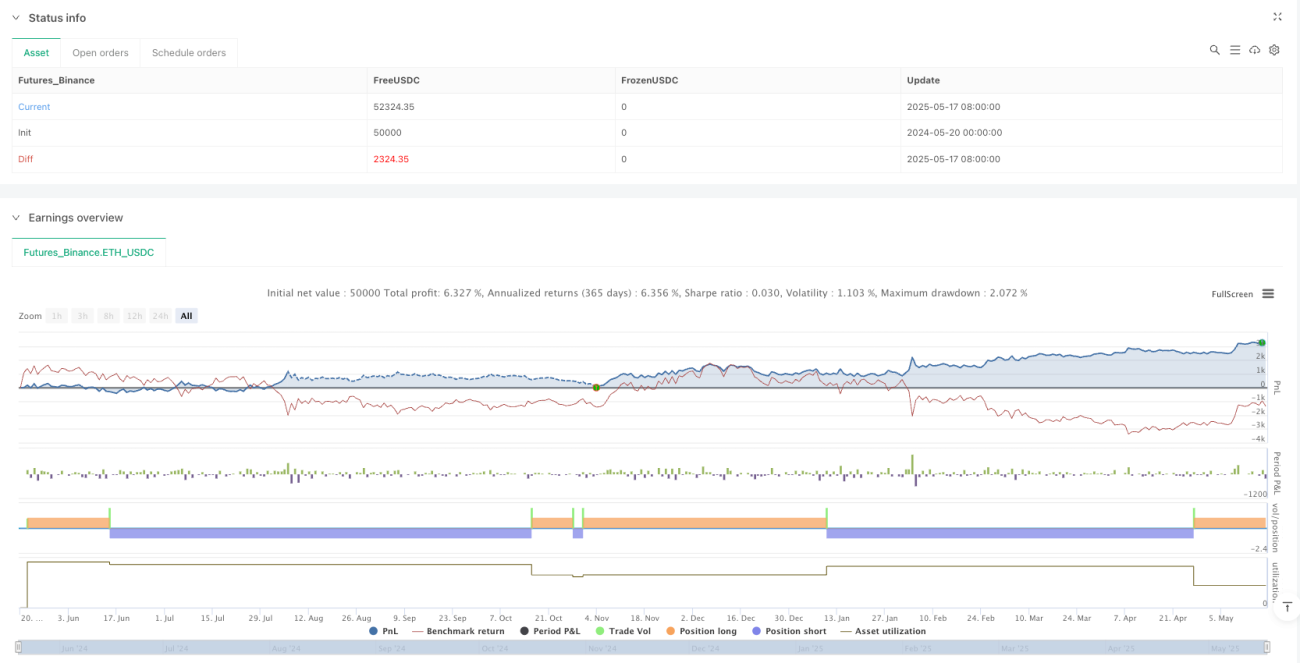
The EMA-RSI Trend Reversal Quantitative Trading System is an elegantly designed technical analysis trading strategy that identifies potential market turning points by combining EMA crossovers and RSI breakouts from overbought/oversold regions. The strategy features clear logic, simple implementation, and is particularly suitable for capturing medium to short-term trend reversal opportunities.
Despite some inherent risks, the strategy's performance and adaptability can be further enhanced through appropriate risk management mechanisms and optimization suggestions. Particularly noteworthy are optimization directions such as dynamic parameter adjustments and multi-indicator confirmations, which are expected to significantly improve the strategy's performance across different market environments.
Overall, this is a quantitative trading strategy with solid foundations and reasonable logic, suitable both for beginners to understand basic principles of technical analysis and for experienced traders as a framework for further customization and optimization. As a trend reversal capture system, it demonstrates unique advantages in identifying market turning points.
- 1