Multi-Indicator Crossover Momentum Trading System: EMA+CPR+Volume Filter with Automated Stop-Loss/Take-Profit Strategy

Overview
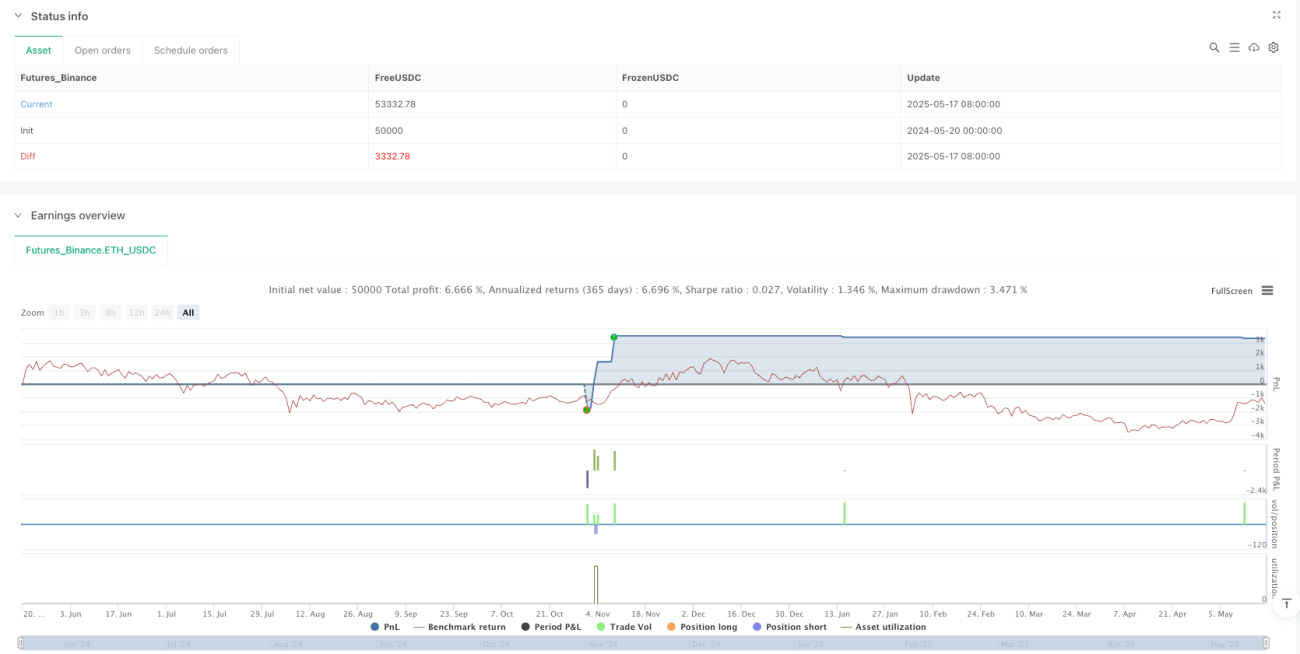
This strategy is a multi-technical indicator trading system combining Exponential Moving Average (EMA) crossovers, Central Pivot Range (CPR), volume filtering, and automated stop-loss/take-profit settings. The core logic identifies market trend direction through EMA fast and slow line crossovers, confirms signals using CPR as additional price reference points, validates market activity with a volume filter, and manages risk through fixed percentage stop-loss and take-profit levels. The strategy is applicable to both futures and equity markets, provides comprehensive backtesting functionality, and allows for parameter adjustments according to user requirements.
Strategy Principles
The core trading logic of this strategy is based on several key components:
-
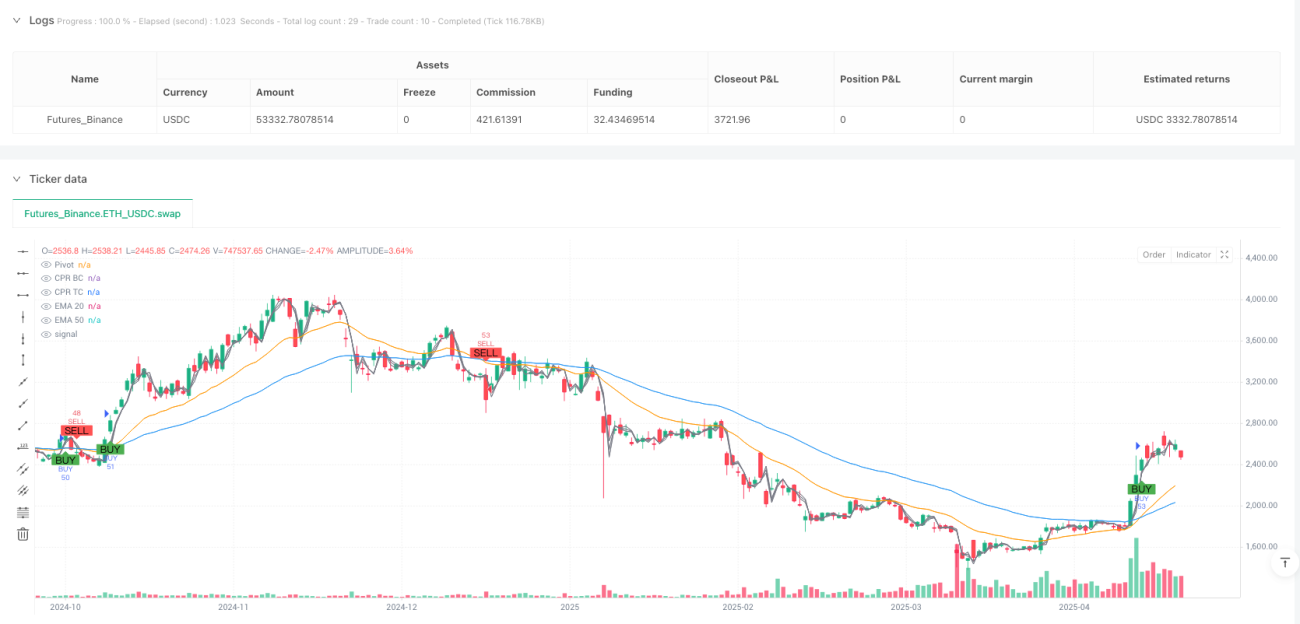
EMA Crossover System: The strategy uses 20-period and 50-period Exponential Moving Averages (EMA) as primary trend indicators. When the fast EMA (20-period) crosses above the slow EMA (50-period), a buy signal is generated; when the fast EMA crosses below the slow EMA, a sell signal is generated. This classic moving average crossover strategy aims to capture trend reversal points.
-
CPR (Central Pivot Range) Confirmation: The strategy incorporates the CPR indicator as a price level confirmation tool. CPR consists of three key price levels: Pivot Point, Bottom Central (BC), and Top Central (TC). These levels are calculated based on the previous day's high, low, and close prices. For long positions, the strategy requires price to be above the pivot point; for short positions, price must be below the pivot point. This adds strictness to trading conditions and can filter out potential false signals.
-
Volume Filter: To avoid trading in low-volume conditions, the strategy sets a condition requiring volume to be greater than the 20-day average volume. High volume typically indicates higher market participation, increasing the reliability of price movements. Users can choose whether to enable this filter.
-
Automated Stop-Loss/Take-Profit: The strategy implements fixed percentage-based stop-loss and take-profit levels from the entry price. In the default settings, stop-loss is placed 1.5% below the entry price, and take-profit is set 3% above the entry price. This creates a risk-reward ratio of 1:2, adhering to healthy risk management principles. These parameters can be adjusted through input controls.
-
Signal Visualization: The strategy visually displays buy and sell signals on the chart in the form of labels and shapes, allowing traders to clearly see entry points.
The trade execution logic is straightforward: when long conditions are met (EMA crossover, price above pivot point, volume condition satisfied), the strategy enters a long position and simultaneously sets stop-loss and take-profit orders. When short conditions are met (EMA crossunder, price below pivot point, volume condition satisfied), the strategy enters a short position with corresponding stop-loss and take-profit orders.
Strategy Advantages
-
Multiple Confirmation Mechanism: The strategy combines trend indicators (EMA), price level indicators (CPR), and volume indicators to form a multiple confirmation system. This reduces the possibility of false signals and improves trading reliability. Single indicators may produce false signals, but confirmation from multiple different types of indicators increases the probability of successful trades.
-
Strong Adaptability: Through adjustable parameters (such as EMA lengths, stop-loss percentage, take-profit percentage, and whether to use volume filtering), the strategy can adapt to different market environments and trader risk preferences. This makes the strategy suitable for both high-volatility markets and relatively stable markets.
-
Integrated Risk Management: The strategy incorporates automatic stop-loss and take-profit mechanisms, which many basic strategies lack. This ensures that each trade has predefined risk and reward targets, avoiding the impact of emotional decisions on trading results.
-
Visualized Trading Signals: The strategy visually displays trading signals on the chart, allowing traders to easily identify entry and exit points, aiding in backtesting and strategy adjustment.
-
Concise and Efficient Code: The strategy code has a clear structure, modular logic, and is easy to understand and modify. This makes it accessible even for traders with limited programming experience to understand how the strategy operates and adjust it according to their needs.
-
Wide Applicability: The strategy is applicable to various trading instruments, including futures and stocks, without requiring special adjustments for specific markets. This universality allows the strategy to maintain relatively stable performance across different market environments.
Strategy Risks
-
False Crossover Signals: EMA crossover strategies may generate multiple false crossover signals in sideways or choppy markets, leading to consecutive losing trades. Although CPR and volume filters help reduce these false signals, this remains a significant risk in markets lacking clear trends. A solution is to suspend trading in sideways markets or add additional trend confirmation indicators.
-
Limitations of Fixed Stop-Loss: The strategy uses fixed percentage-based stop-losses relative to entry price, which may not be suitable for all market environments and volatility conditions. In high-volatility markets, fixed percentage stops may be too tight; in low-volatility markets, they may be too loose. A possible solution is to use dynamic stops based on ATR (Average True Range) to better adapt to market volatility.
-
Slippage and Execution Risk: The strategy assumes all orders can be executed at specified prices, but in actual trading, slippage and execution delays may occur, especially in markets with limited liquidity. This can lead to differences between actual trading results and backtesting results. To mitigate this risk, more conservative settings can be used in actual trading, such as increasing stop-loss ranges or reducing position sizes.
-
Parameter Overfitting: The strategy's performance heavily depends on the selected parameters (EMA lengths, stop-loss/take-profit percentages, etc.). Overfitting parameters may result in good performance in backtesting but poor performance in actual trading. The solution is to use longer backtesting periods and test the strategy's robustness under multiple market conditions.
-
Limitations of Daily CPR: The strategy uses daily data to calculate CPR, which may not be flexible or responsive enough for intraday trading or shorter timeframes. A possible solution is to adjust the CPR calculation period according to the timeframe being used.
-
Volume False Signals: Simply relying on volume being higher than the 20-day average may not be sufficient to accurately judge market activity. Some abnormal trading days may see volume spikes that don't represent true trend confirmation. Consider incorporating more complex volume analysis, such as volume trends or relative volume change rates.
Strategy Optimization Directions
-
Improved Trend Identification Mechanism: The current strategy mainly relies on EMA crossovers to identify trends. Consider adding additional trend indicators, such as ADX (Average Directional Index), to ensure trading only in strong trend markets. This will help filter false signals in sideways markets, improving trade quality rather than quantity. In code implementation, an ADX>25 condition could be added as an additional trade filter.
-
Dynamic Stop-Loss and Take-Profit: Replace fixed percentage-based stops and targets with volatility indicators like ATR to better adapt to the volatility of different market environments. For example, stop-loss could be set at 2x ATR and take-profit at 4x ATR, maintaining the same risk-reward ratio but better adapting to market conditions.
-
Enhanced Volume Analysis: Improve the volume filter to consider not just volume size but also volume trends and price-volume relationships. For example, add conditions requiring volume increases to align with price direction, or use more complex volume indicators such as OBV (On-Balance Volume).
-
Optimized Entry Timing: The current strategy enters immediately when a crossover occurs. Consider adding confirmation conditions, such as waiting for price pullbacks to key support/resistance levels or waiting for 1-2 periods of confirmation, to reduce the risk of false breakouts. This can be implemented by delaying entry signals or adding price pattern confirmations.
-
Add Market Environment Filters: Incorporate market environment assessment logic, for example by using volatility indicators (such as VIX or ATR) to determine the current market state, and use different parameter settings or even suspend trading in different market environments. For instance, in high-volatility markets, wider stops and more conservative position sizing might be needed.
-
Simulate Volume Absence Scenarios: To enhance the strategy's applicability in markets where volume data is missing or unreliable, develop an alternative version that doesn't require volume, for example using price range or other technical indicators as substitutes for volume confirmation.
-
Add Time Filters: Consider adding time filtering conditions to avoid trading during high-volatility periods around market open and close, or around major economic data releases. This can be implemented by checking the current trading time and setting allowed trading windows.
Conclusion
This trading strategy based on EMA crossovers, CPR, and volume filtering provides a comprehensive trading system framework that combines trend following, price level confirmation, and volume validation, with built-in risk management functionality. The core advantages of the strategy lie in its multiple confirmation mechanisms and automated stop-loss/take-profit settings, which help improve trading reliability and discipline.
However, like all trading strategies, it faces challenges such as false signal risks and limitations of fixed parameters. Through the optimization directions proposed above, especially improved trend identification, dynamic stop-loss/take-profit adjustments, and enhanced market environment filtering, the strategy's robustness and adaptability can be further improved.
For traders, this strategy provides a good starting point that can be customized according to individual trading styles and market preferences. Most importantly, regardless of how the strategy is modified, sound risk management principles should always be maintained, parameter overfitting should be avoided, and thorough backtesting and simulated trading verification should be conducted before live trading.
/*backtest
start: 2024-05-20 00:00:00
end: 2025-05-18 08:00:00
period: 1d
basePeriod: 1d
exchanges: [{"eid":"Futures_Binance","currency":"ETH_USDC"}]
*/

//@version=6
strategy("Backtest: EMA + CPR + Volume + SL/Target", overlay=true, default_qty_type=strategy.percent_of_equity, default_qty_value=1)

// === INPUTS === //- 1