
Overview
The Multi-Moving Average Angle Trend Reversal Trading System is a quantitative trading strategy specifically designed for sideways markets, combining multiple moving averages and angle analysis techniques. The core of this strategy is to monitor the relationships between four different moving averages (two EMAs and two SMAs) while utilizing angle changes in the long-term moving average to identify market trend reversal points, thereby capturing high-probability trading opportunities in range-bound markets. The system particularly focuses on the crossovers between MA50 and EMA20, combined with angle changes in MA150 to filter out false signals, achieving precise entry and exit in oscillating markets.
Strategy Principles
The operational principles of this strategy are based on the collaborative analysis of four key moving averages:
- Short-term EMA (default 15 periods): Reflects short-term price movements, represented in green
- Medium-long term EMA (default 100 periods): Reflects medium to long-term trends, represented in red
- Medium-term SMA (default 20 periods): Used to generate crossover signals, represented in blue
- Long-term SMA (default 200 periods): Used to analyze major market trends, represented in orange
The core logic of the strategy lies in:
- Forming a "TBO Cloud" through EMA20 and EMA40, providing an intuitive indication of market bias
- Calculating the angle changes of MA150 (orange long-term average) to determine overall market trend strength
- Considering the market in a sideways state when the MA150 angle is less than the set threshold (default 5 degrees)
- Utilizing the crossover of MA50 (blue line) and EMA20 (green line) to generate trading signals in sideways markets
- Buy condition: When EMA20 is below EMA40 (in the red cloud) and MA50 crosses below EMA20, while MA150 has no significant downward trend
- Sell condition: When EMA20 is above EMA40 (in the green cloud) and MA50 crosses above EMA20, while MA150 has no significant upward trend
- Automatically closing positions when the MA150 angle reverses (from rising to not rising or from falling to not falling)
The uniqueness of this strategy lies in its focus on capturing oscillation opportunities in sideways markets rather than chasing strong trends, filtering out false reversal signals in strong trend environments through angle analysis techniques.
Strategy Advantages
-
Sideways Market Specialization: The strategy is specifically designed for sideways oscillating markets, avoiding the common "chasing highs and selling lows" trap of trend-following strategies.
-
Multiple Confirmation Mechanisms: A multi-layered confirmation system is built through four different period moving averages and angle analysis, improving signal quality.
-
Innovative Angle Analysis: The introduction of MA150 angle calculation to determine market trend strength and reversal is an innovation distinguishing it from traditional moving average systems.
-
Automatic Risk Management: The strategy incorporates an automatic position closing mechanism based on trend reversals, exiting the market immediately when the major trend direction changes, effectively controlling risk.
-
Visualized Trading Environment: The "TBO Cloud" and clear color system allow traders to intuitively understand current market conditions and signal quality.
-
Adjustable Parameters: All key parameters can be adjusted, making the strategy adaptable to different market environments and trader styles.
-
Counter-Trend Trading Capability: By identifying moments when trends temporarily weaken, the strategy can capture short-term reversal opportunities before trend continuation.
Strategy Risks
-
False Signal Risk: In highly volatile markets, moving averages may frequently cross, generating false signals and leading to overtrading and losses. The solution is to add additional filtering conditions or expand moving average periods.
-
Delayed Response Issue: Due to the use of multiple moving averages, the strategy may have a certain delay in responding to market changes, missing optimal entry or exit points. This can be reduced by adjusting the parameters of shorter-period EMAs.
-
Trend Judgment Accuracy: The MA150 angle calculation uses a fixed period (5) to calculate slope, which may not accurately reflect trend strength across different timeframes. It's recommended to dynamically adjust this parameter based on the trading timeframe.
-
Parameter Sensitivity: The strategy is sensitive to various moving average parameters and angle threshold settings, with different parameter combinations yielding significantly different performance. Optimal parameter combinations for specific markets need to be identified through backtesting.
-
Market Environment Dependency: The strategy may not perform well in strong trend markets, as it is designed specifically for sideways markets. Traders need the ability to identify market states or incorporate market environment filters.
-
Lack of Stop-Loss Mechanism: The strategy lacks explicit stop-loss mechanisms, relying only on signal reversal or trend angle changes to exit, potentially facing significant losses in extreme market conditions. It's advisable to supplement with stop-loss mechanisms based on fixed proportions or volatility.
Strategy Optimization Directions
-
Dynamic Parameter Adjustment: Volatility indicators (such as ATR) can be introduced to dynamically adjust moving average periods and angle thresholds based on market volatility, allowing the strategy to self-adapt to different market environments.
-
Incorporate Volume Analysis: Combine volume information to verify the reliability of moving average crossover signals, executing trades only when crossovers are accompanied by significant volume changes, effectively reducing false signals.
-
Multi-Timeframe Analysis: Introduce higher timeframe trend judgments to filter signals, for example, entering only when the daily trend direction aligns with the current trading signal, improving the overall win rate of the strategy.
-
Optimize Angle Calculation Method: Change the fixed-period angle calculation to an adaptive period based on market volatility, or use more advanced trend strength measurement methods such as regression analysis to improve the accuracy of angle judgment.
-
Add Stop-Loss and Profit-Taking Mechanisms: Incorporate stop-loss settings based on ATR or support/resistance levels, as well as profit-taking mechanisms based on risk-reward ratios, perfecting the risk management framework.
-
Add Market State Filter: Develop a market state classifier to identify whether the current market is in a trending, sideways, or chaotic state, activating the strategy only in suitable market states.
-
Integrate Machine Learning Algorithms: Utilize machine learning techniques to optimize signal generation and filtering processes, training models with historical data to predict signal success probability.
Conclusion
The Multi-Moving Average Angle Trend Reversal Trading System is an innovative quantitative strategy focused on sideways markets, constructing a complete trading framework through four differently parameterized moving averages and angle analysis techniques. The core advantages of the strategy lie in its specialization for sideways markets and innovative angle analysis method, effectively identifying market trend turning points and filtering out false signals. Despite risks such as parameter sensitivity and market environment dependency, through the proposed optimization directions like dynamic parameter adjustment, multi-timeframe analysis, and improved risk management systems, the strategy has the potential to further enhance performance. For traders seeking stable returns in oscillating markets, this is a strategy framework worth in-depth research and practice.
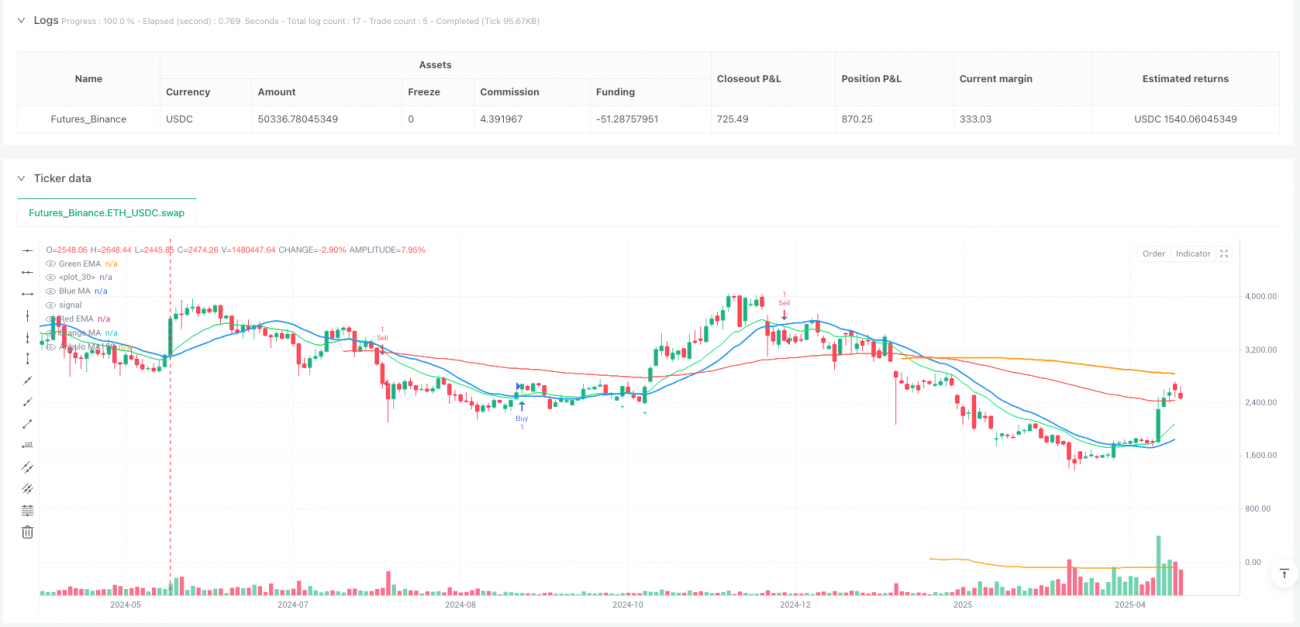
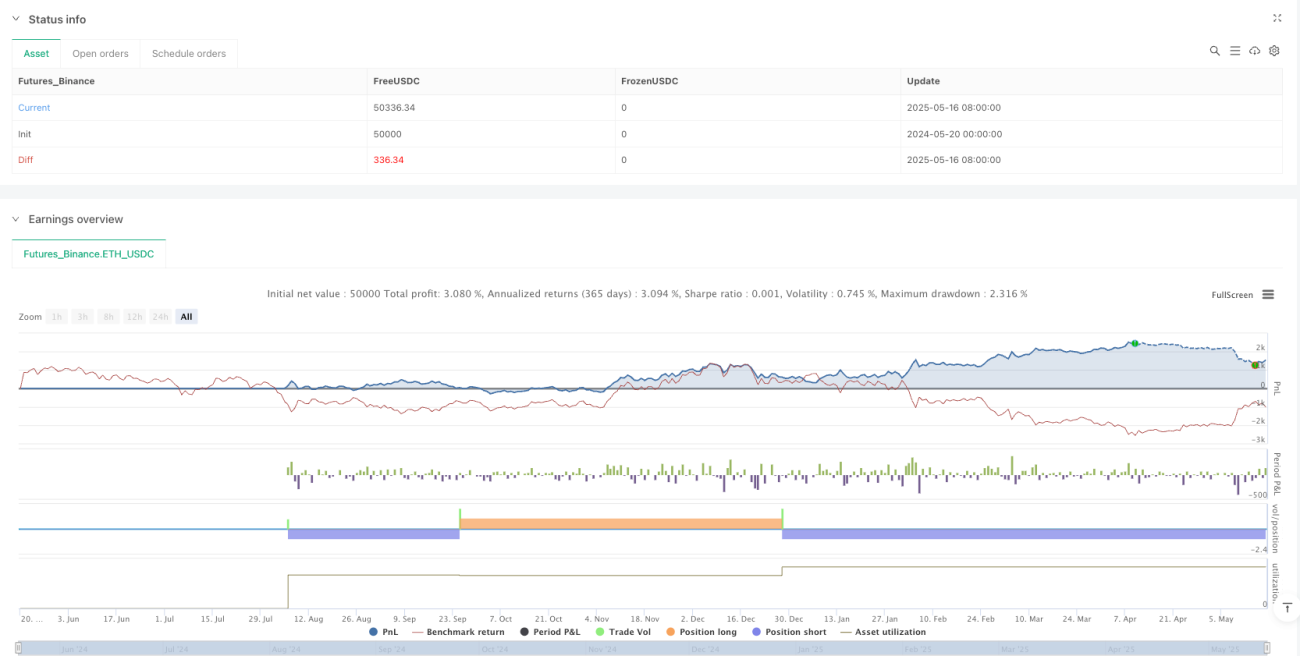
/*backtest
start: 2024-05-20 00:00:00
end: 2025-05-18 08:00:00
period: 2d
basePeriod: 2d
exchanges: [{"eid":"Futures_Binance","currency":"ETH_USDC"}]
*/

// This Pine Script® code is subject to the terms of the Mozilla Public License 2.0 at https://mozilla.org/MPL/2.0/
// © pabloportugalgarcia

//@version=5- 1