
Overview
The High-Frequency EMA Crossover Pullback Strategy is a lightweight and efficient trading system designed for highly volatile markets such as cryptocurrencies, forex, and indices. The strategy's core relies on crossover signals between fast and slow Exponential Moving Averages (EMA), combined with volume confirmation mechanisms to capture market trends and pullback opportunities. The strategy executes only long positions, maximizing the utilization of uptrends through a dual mechanism of initial buy signals and pullback re-entry signals. Additionally, the strategy employs a risk management approach that combines fixed take-profit and trailing stop-loss methods, ensuring trading safety while pursuing maximum returns. Its streamlined and efficient design makes it particularly suitable for short-term traders and high-frequency trading strategies.
Strategy Principles
The strategy operates based on the following core components:
-
Trend Identification System: Uses the relative position of a 14-period fast EMA and 28-period slow EMA to determine market trend. A bullish trend is confirmed when the fast EMA is positioned above the slow EMA.
-
Entry Signal System:
- Initial Buy Signal: Triggered when the fast EMA crosses above the slow EMA, indicating the potential start of a new uptrend.
- Pullback Re-entry Signal: Triggered within a confirmed bullish trend when the price pulls back to above the fast EMA with volume exceeding the threshold, capturing opportunities within trend pullbacks.
-
Volume Confirmation Mechanism: Uses a 28-period (same as slow EMA) volume SMA as a benchmark, requiring re-entry signal volume to exceed a preset multiple (default 1.0) of the benchmark volume, ensuring sufficient market participation at re-entry points.
-
Risk Management System:
- Fixed Take Profit: Set at 0.1% (default) above the entry price.
- Trailing Take Profit: Initially set at 0.01% (default) above the entry price, moving higher as the price increases.
- Trailing Stop Loss: Set at 0.01% (default) below the current price, adjusting with price movements.
-
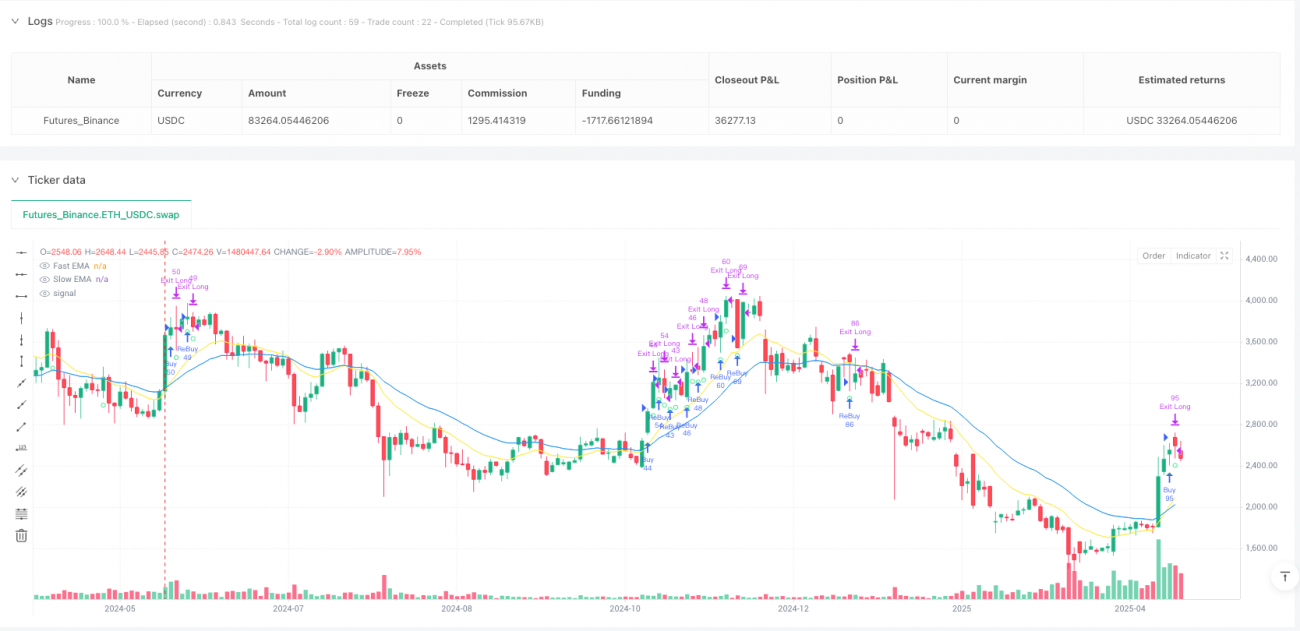
Visualization System:
- Line charts displaying fast and slow EMAs.
- Initial buy signals marked with green upward triangles.
- Pullback re-entry signals marked with light green dots.
-
Alert System: Supports Webhook integration with third-party platforms (such as 3Commas) for automated execution or manual trading notifications.
Strategy Advantages
-
Efficiency of Dual Entry Mechanism: Captures trend initiation points through initial signals and pullback opportunities through re-entry signals, significantly improving capital utilization efficiency and profit opportunities.
-
Precise Volume Confirmation: Uses relative volume (relative to moving average volume) rather than absolute volume, better adapting to different markets and time periods.
-
Flexible Risk Management: Combines fixed take-profit with trailing stop-loss, both securing profits in rapid market movements and maximizing returns in sustained uptrends.
-
Easy to Optimize and Customize: All key parameters (EMA lengths, volume threshold, take-profit and stop-loss percentages) can be adjusted through input parameters, facilitating optimization for different markets and personal risk preferences.
-
Lightweight Computation: The strategy uses only basic indicators such as EMA and SMA, reducing computational burden and making it suitable for high-frequency trading and rapid execution environments.
-
Clear Visual Signals: Traders can intuitively distinguish between initial entry points and re-entry points through different shapes and colors of markers, facilitating strategy understanding and execution monitoring.
-
Alert System Support: Built-in alertcondition functionality supports integration with trading automation systems, reducing manual monitoring burden.
Strategy Risks
-
False Breakout Risk: EMA crossovers may generate false breakout signals, especially in ranging markets. Solution: Consider adding additional trend confirmation indicators, such as ADX or ATR, to filter out signals in weak trend environments.
-
Overtrading Risk: High-frequency strategies may lead to excessive trading, increasing transaction costs. Solution: Increase volume threshold or set trading interval time restrictions to reduce trading frequency.
-
Tight Stop Loss Settings: The 0.01% trailing stop loss may be too sensitive in highly volatile markets, leading to frequent triggering. Solution: Adjust stop loss percentage based on the volatility characteristics of the trading instrument, or consider using ATR dynamic stop loss.
-
Limitations of Long-Only Strategy: The current strategy executes only long trades, unable to profit in downward markets. Solution: Extend the strategy to include short trading functionality, or add market environment filters to activate the strategy only in overall uptrends.
-
Parameter Sensitivity: Strategy performance may be highly sensitive to EMA parameter selection. Solution: Conduct comprehensive parameter optimization and backtesting to find parameter combinations that perform stably across different market conditions.
-
Slippage and Liquidity Risk: Significant slippage may be encountered in low liquidity markets or during high volatility periods. Solution: Set maximum slippage tolerance and avoid trading during low liquidity periods.
-
Volume False Signals: Relying solely on volume may be influenced by market manipulation. Solution: Cross-validate with multiple volume indicators (such as OBV, CMF).
Strategy Optimization Directions
-
Multi-Timeframe Confirmation System: Introduce higher timeframe trend confirmation mechanisms, executing trades only when the higher timeframe trend direction aligns with the trading direction, effectively reducing false breakouts and counter-trend trades.
-
Dynamic Parameter Adjustment: Dynamically adjust EMA lengths and stop-loss/take-profit ratios based on market volatility (such as ATR), enabling the strategy to better adapt to different market environments.
-
Add Short Trading Functionality: Extend the strategy to support short trading, making it a complete two-way trading system and improving profitability across all market environments.
-
Optimize Volume Filter: Consider using more complex volume indicators (such as relative volume index or OBV) instead of simple volume thresholds to improve the quality of re-entry signals.
-
Introduce Time Filters: Add trading time window restrictions to avoid low liquidity or high volatility periods, such as late-night periods in certain cryptocurrency markets.
-
Integrate Machine Learning Models: Use machine learning algorithms to dynamically predict optimal EMA parameters and volume thresholds, allowing the strategy to self-adapt to market changes.
-
Improve Take-Profit Mechanism: Implement partial take-profit functionality, allowing for batch closing of positions as different price targets are reached, both securing partial profits and retaining upside potential.
-
Add Risk Management Layers: Introduce daily maximum loss limits and volatility-adaptive position sizing adjustments to enhance the strategy's capital safety.
Summary
The High-Frequency EMA Crossover Pullback Strategy is a well-designed short-term trading system that effectively captures market trends and pullback opportunities by combining EMA crossover signals with volume confirmation. Its dual entry mechanism (initial signals and re-entry signals) enables the strategy to maximize utilization of trending markets, while the risk management system combining fixed take-profit with trailing stop-loss provides a favorable risk-reward ratio.
The strategy's main advantages lie in its lightweight design and clear trading logic, making it easy to understand, execute, and optimize. Additionally, the built-in visualization components and alert system support further enhance the strategy's practicality.
Despite some inherent risks such as false breakouts, overtrading, and parameter sensitivity, these risks can be effectively mitigated through various optimization directions mentioned above. Particularly, by introducing multi-timeframe confirmation, dynamic parameter adjustment, and improved risk management mechanisms, the strategy's robustness and adaptability can be significantly enhanced.
For traders pursuing high-frequency trading opportunities, this strategy provides a solid foundation framework that can be further customized and optimized according to individual risk preferences and specific market characteristics. Through continuous backtesting and parameter adjustment, this strategy has the potential to become an effective trading tool in cryptocurrency and other highly volatile markets.
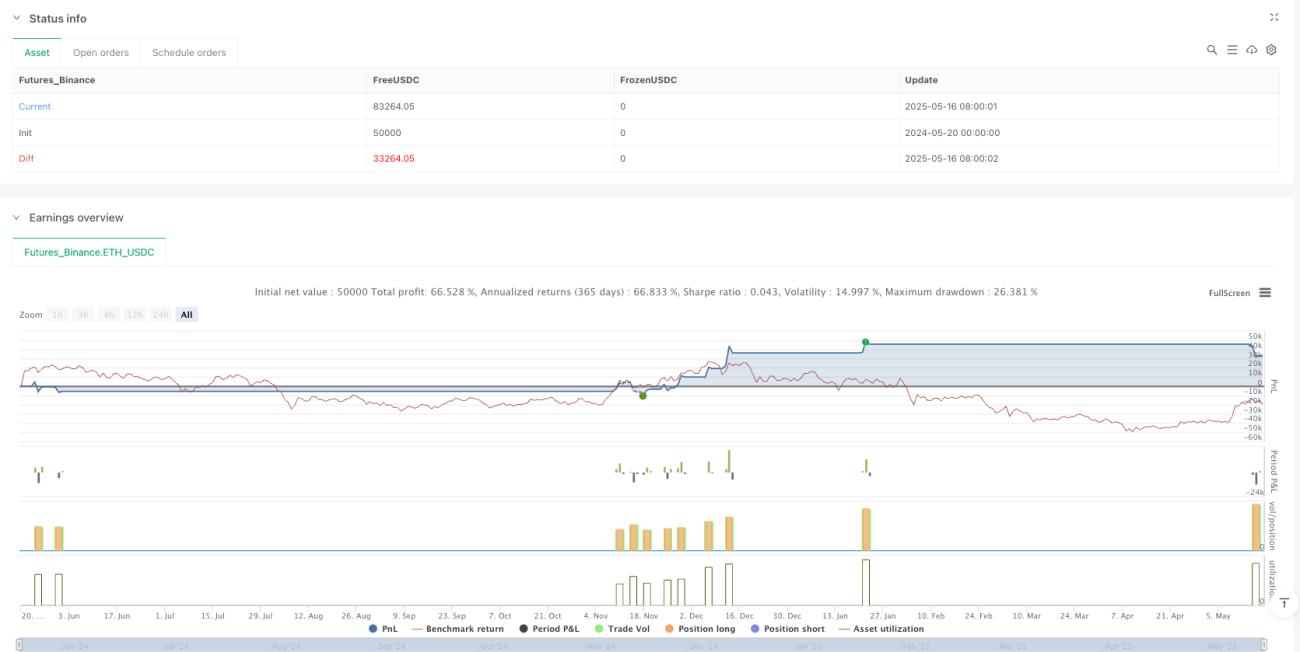
/*backtest
start: 2024-05-20 00:00:00
end: 2025-05-18 08:00:00
period: 2d
basePeriod: 2d
exchanges: [{"eid":"Futures_Binance","currency":"ETH_USDC"}]
*/

//@version=5
strategy("Crypto Scalping Strategy [Dubic] - LONG Only", overlay=true, default_qty_type=strategy.percent_of_equity, default_qty_value=1)

// === Inputs ===- 1