
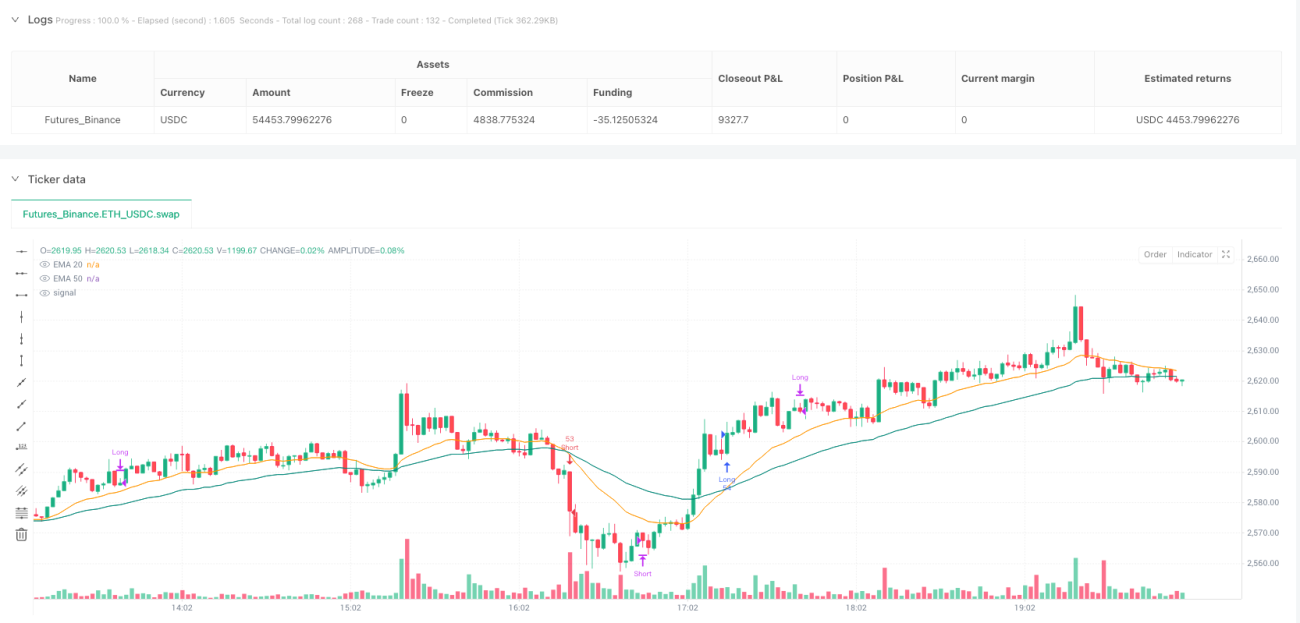
Overview
The Triple Indicator Trend Confirmation Quantitative Trading Strategy is a comprehensive trading system that combines three classic technical indicators to filter out false breakouts and improve trading success rates through multiple signal confirmations. This strategy leverages the synergistic effect of EMA (Exponential Moving Average), MACD (Moving Average Convergence Divergence), and RSI (Relative Strength Index), executing trades only after confirming a clear trend direction. The system includes complete entry and exit conditions and provides real-time visualization of trading signals, making it suitable for medium to long-term trend-following traders.
Strategy Principles
This strategy is based on the core principle of triple indicator confirmation, requiring all three technical indicators to simultaneously point to the same trading direction before executing a trade. The specific logic is as follows:
-
Long Entry Conditions:
- EMA20 crosses above EMA50 (trend turning upward)
- MACD line is above the signal line (upward momentum)
- RSI is greater than 50 (overbought zone, showing upward strength)
When these three conditions are simultaneously met, the system issues a buy signal.
-
Short Entry Conditions:
- EMA20 crosses below EMA50 (trend turning downward)
- MACD line is below the signal line (downward momentum)
- RSI is less than 50 (oversold zone, showing downward strength)
When these three conditions are simultaneously met, the system issues a sell signal.
-
Exit Conditions:
- Exit Long: When the MACD line crosses below the signal line
- Exit Short: When the MACD line crosses above the signal line
The system also includes a real-time dashboard displaying the current trading signal status, RSI value, relative position of MACD to its signal line, and relative position of EMA20 to EMA50, enabling traders to clearly understand market conditions.
Strategy Advantages
Through in-depth analysis of the code, this strategy demonstrates the following significant advantages:
-
Multiple Confirmation Mechanism: By requiring confirmation from three different types of indicators (trend, momentum, and strength), the probability of false breakouts and erroneous signals is significantly reduced.
-
Trend Following Combined with Momentum: EMA crossovers provide trend direction, MACD confirms momentum, and RSI confirms strength, offering a more comprehensive market perspective when combined.
-
Clear Exit Mechanism: A clear exit strategy based on MACD and signal line crossovers helps secure profits and control risk.
-
Visual Dashboard: Real-time display of key indicator statuses helps traders quickly assess market conditions and the rationality of current positions.
-
Complete Alert System: Built-in alert conditions allow traders to receive notifications at crucial moments without having to continuously monitor charts.
-
Flexible Money Management: Uses a percentage-based money management approach (default 10%), adapting to accounts of different sizes.
Strategy Risks
Despite its multiple advantages, this strategy still has the following potential risks:
-
Lag Issues: All indicators used (EMA, MACD, and RSI) are lagging indicators, which may result in delayed entries and exits in rapidly changing markets, missing optimal price points.
-
Poor Performance in Ranging Markets: The strategy performs well in strong trend markets but may generate frequent false signals in sideways or low-volatility markets, leading to multiple small losses.
-
Over-reliance on Technical Indicators: The strategy is entirely based on technical indicators, ignoring fundamental factors and market structure, potentially failing during major news events or black swan events.
-
Parameter Sensitivity: The strategy uses fixed parameter settings (such as EMA periods, RSI thresholds), while different market environments may require different parameter optimizations.
-
Lack of Stop-Loss Mechanism: The current strategy only exits based on MACD crossovers without setting price-based stop losses, potentially leading to larger losses in extreme market conditions.
To mitigate these risks, traders can consider adding fixed stop losses, volatility filters, and dynamically adjusting parameters based on different market conditions.
Strategy Optimization Directions
Based on the code analysis, this strategy can be optimized in the following directions:
-
Adding Adaptive Parameters: Make the period parameters for EMA, MACD, and RSI adaptive, automatically adjusting based on market volatility to better suit different market environments. This is because fixed parameters perform differently under varying volatility conditions.
-
Adding Volatility Filters: Introduce volatility indicators such as ATR or Bollinger Bandwidth to pause trading or adjust parameters in low-volatility environments, avoiding frequent false signals in ranging markets.
-
Adding Fixed and Trailing Stop Losses: On top of the existing MACD-based exits, add ATR-based fixed stop losses and trailing stop mechanisms to better control risk.
-
Incorporating Volume Filters: Combine volume indicators for confirmation, only entering positions when trend changes are supported by volume, further reducing false breakouts.
-
Introducing Time Filters: Add trading session filter functionality to avoid low-liquidity periods and high-volatility but directionless market opening periods.
-
Optimizing Money Management: Dynamically adjust position size based on signal strength and market conditions, increasing positions on stronger confirmation signals to improve capital efficiency.
-
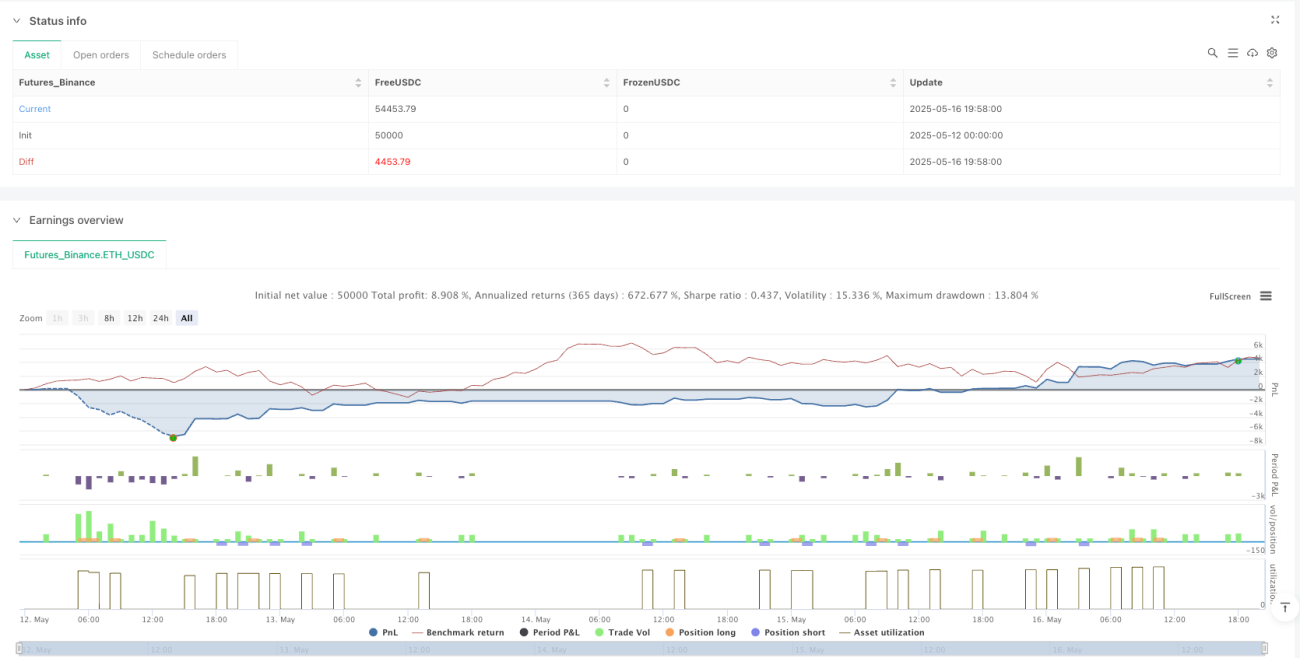
Adding Backtesting Statistics Panel: Add more detailed strategy performance statistics, such as Sharpe ratio, maximum drawdown, profit/loss ratio, etc., to help traders evaluate strategy effectiveness.
Summary
The Triple Indicator Trend Confirmation Quantitative Trading Strategy constructs a trading system requiring multiple confirmations by combining the classic technical indicators of EMA, MACD, and RSI, effectively reducing the risk of false signals. The strategy features clear entry and exit rules, complemented by a visual dashboard and alert system, providing traders with a complete decision-making toolkit.
Despite inherent risks such as lag and dependence on trending markets, through the suggested optimization directions like adding adaptive parameters, volatility filters, and improved risk management, this strategy can further enhance its stability and profitability in different market environments.
Overall, this strategy is suitable for medium to long-term trend-following traders seeking systematic trading methods, especially those who aim to improve trade quality rather than quantity through multiple technical indicator confirmations. When used correctly and adjusted according to individual risk tolerance, this system can provide relatively reliable trading signals and a risk control framework.
/*backtest
start: 2025-05-12 00:00:00
end: 2025-05-16 20:00:00
period: 2m
basePeriod: 2m
exchanges: [{"eid":"Futures_Binance","currency":"ETH_USDC"}]
*/

//@version=5
strategy("EMA-MACD-RSI Strategy PRO", overlay=true, default_qty_type=strategy.percent_of_equity, default_qty_value=1)

// === Indicatori ===- 1