
Overview
The Dynamic ATR-Based Trendline Breakout Trading Strategy is a quantitative trading system that combines technical analysis with risk management. The strategy identifies key pivot points (highs and lows) in the market to construct dynamically sloped trendlines, and executes trades when price breaks through these trendlines. The core of this strategy lies in utilizing ATR (Average True Range) to adjust trendline slopes, allowing them to adapt to volatility changes across different market environments. Additionally, the strategy integrates a comprehensive risk management system, including automatically set stop-loss levels and two take-profit targets based on risk-reward ratios, providing traders with a complete trading solution.
Strategy Principles
The strategy operates based on several key components working in harmony:
-
Pivot Point Detection: The strategy uses a specified lookback period (default 14 periods) to identify pivot highs and pivot lows in the market, which serve as the foundation for constructing trendlines.
-
Slope Calculation: By calculating the ATR and dividing it by the lookback length, then multiplying by a custom slope multiplier, the strategy determines the inclination angle of the trendlines. This ensures that trendlines dynamically adjust according to actual market volatility.
-
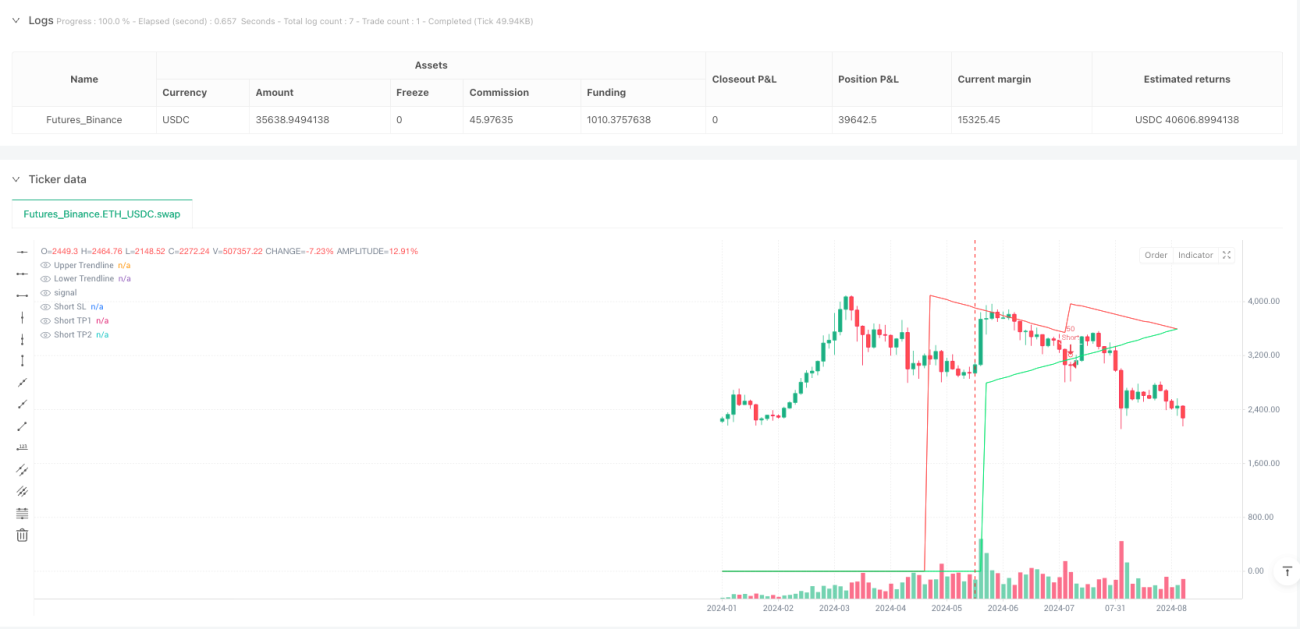
Trendline Construction:
- Upper Trendline: Starts from pivot highs and slopes downward each period
- Lower Trendline: Starts from pivot lows and slopes upward each period
-
Entry Conditions:
- Long Entry: When a pivot low occurs and the closing price breaks above the upper trendline
- Short Entry: When a pivot high occurs and the closing price breaks below the lower trendline
-
Risk Management Mechanism:
- Stop-Loss: Based on the relative trendline position at breakout, plus a customizable buffer
- Take-Profit: Features two targets based on customizable risk-reward ratios (default 1.5x and 2.5x risk)
During trade execution, the strategy automatically calculates the risk for each trade (the distance from entry point to stop-loss) and sets corresponding take-profit targets, achieving precise quantification of risk and reward.
Strategy Advantages
-
High Adaptability: Through ATR-based dynamic trendlines, the strategy can self-adjust to adapt to volatility changes across different market conditions, avoiding the issues of traditional static trendlines that trigger too early in high-volatility markets or remain insensitive in low-volatility markets.
-
Clear Trading Signals: The strategy provides clear entry criteria—trendline breakouts—which is a time-tested effective concept in technical analysis, reducing subjective factors in trading decisions.
-
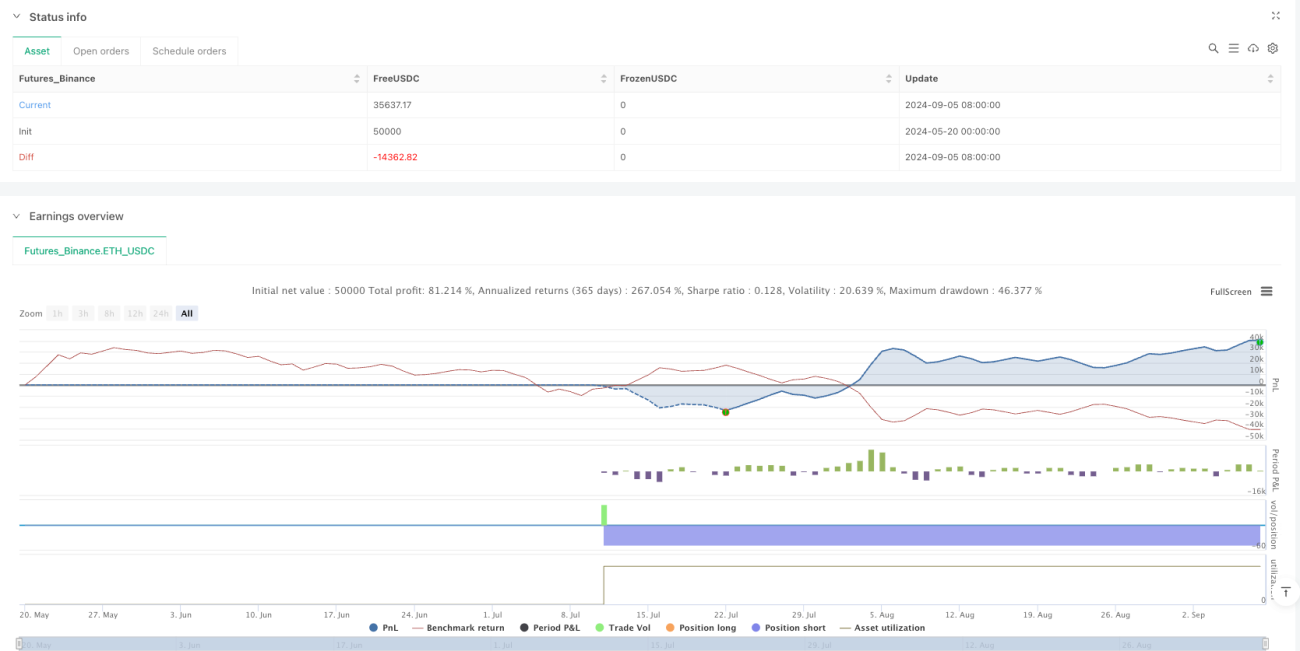
Comprehensive Risk Management: Each trade includes predefined stop-loss positions, ensuring risk is contained within acceptable ranges, and optimizes profit-taking through two take-profit targets, allowing partial positions to profit at closer targets while letting remaining positions pursue greater returns.
-
Visual Assistance: The strategy includes comprehensive visual elements, including trendline diagrams, entry signal markers, and stop-loss/take-profit labels, enabling traders to intuitively understand and monitor the strategy's operational status.
-
Parameter Adjustability: Offers multiple customizable parameters, including pivot detection length, slope multiplier, stop-loss buffer, and risk-reward ratio settings, allowing traders to optimize adjustments based on personal risk preferences and different market environments.
Strategy Risks
-
False Breakout Risk: In ranging markets, prices may frequently break through trendlines briefly before quickly retracing, leading to false signals and losing trades. The solution is to add confirmation mechanisms, such as requiring closing price confirmation of breakouts or integrating volume analysis.
-
Parameter Sensitivity: The choice of ATR period and slope multiplier significantly impacts strategy performance. Too small an ATR period may cause trendlines to be overly sensitive, while too large may result in sluggish responses. It is recommended to find the optimal parameter combination for specific markets and timeframes through historical backtesting.
-
Slippage Risk: In rapid breakouts or high-volatility markets, actual execution prices may differ from signal trigger prices, affecting the strategy's actual performance. Traders should consider including slippage simulation in backtesting and using limit orders rather than market orders in live trading.
-
Overtrading Risk: If parameters are improperly set, the strategy may generate excessive trading signals in the short term, increasing trading costs and potentially reducing overall returns. This can be mitigated by adding trading filters (such as trend confirmation indicators) to reduce noise trades.
-
Market Environment Dependency: This strategy may perform better in trending markets than in oscillating markets. It is advisable to add market environment recognition mechanisms to dynamically adjust parameters or pause trading in different market states.
Strategy Optimization Directions
-
Market Environment Filter: Integrate ADX (Average Directional Index) or similar indicators to identify whether the market is in a trending or oscillating state, and adjust strategy parameters or pause trading accordingly. This will significantly enhance the strategy's robustness across different market conditions.
-
Volume Confirmation: Incorporate volume analysis into the entry decision process, confirming breakout signals only when volume increases, which helps filter out weak false breakouts.
-
Dynamic Risk-Reward Ratio: Dynamically adjust risk-reward ratios based on market volatility or historical performance data, potentially setting higher targets in high-volatility environments and more conservative targets in low-volatility markets.
-
Time Filter: Implement time-based trading restrictions to avoid known periods of low liquidity or high uncertainty (such as before and after market openings, during important economic data releases).
-
Drawdown Control Mechanism: Add risk control mechanisms based on account equity drawdowns, such as automatically reducing position sizes or pausing trading after consecutive losses until market conditions improve.
-
Multi-Timeframe Analysis: Introduce trend confirmation from higher timeframes, only trading when the trend direction in higher timeframes is consistent, improving signal quality.
Conclusion
The Dynamic ATR-Based Trendline Breakout Trading Strategy is a comprehensive trading system that combines classic concepts of technical analysis with modern quantitative methods. Through dynamically adjusted trendlines and precise risk management mechanisms, this strategy provides traders with a systematic approach to identify and execute breakout trading opportunities.
The core strengths of the strategy lie in its adaptability and risk control capabilities, allowing it to dynamically adjust across different market environments while effectively managing the risk and reward of each trade through preset stop-losses and multi-tiered take-profit targets. However, like all trading strategies, it also faces challenges such as false breakouts and parameter optimization.
Through the suggested optimization directions, especially market environment filtering, volume confirmation, and multi-timeframe analysis, traders can further enhance the strategy's robustness and profitability. Ultimately, the successful application of this strategy depends on the trader's understanding of market characteristics, fine-tuning of strategy parameters, and disciplined execution of risk management principles.
/*backtest
start: 2024-05-20 00:00:00
end: 2024-09-08 00:00:00
period: 3d
basePeriod: 3d
exchanges: [{"eid":"Futures_Binance","currency":"ETH_USDC"}]
*/

//@version=5
strategy("Smart Trendlines Strategy with SL/TP (Hybrid)", overlay=true, default_qty_type=strategy.percent_of_equity, default_qty_value=1)

// === Input Parameters ===- 1