
Overview
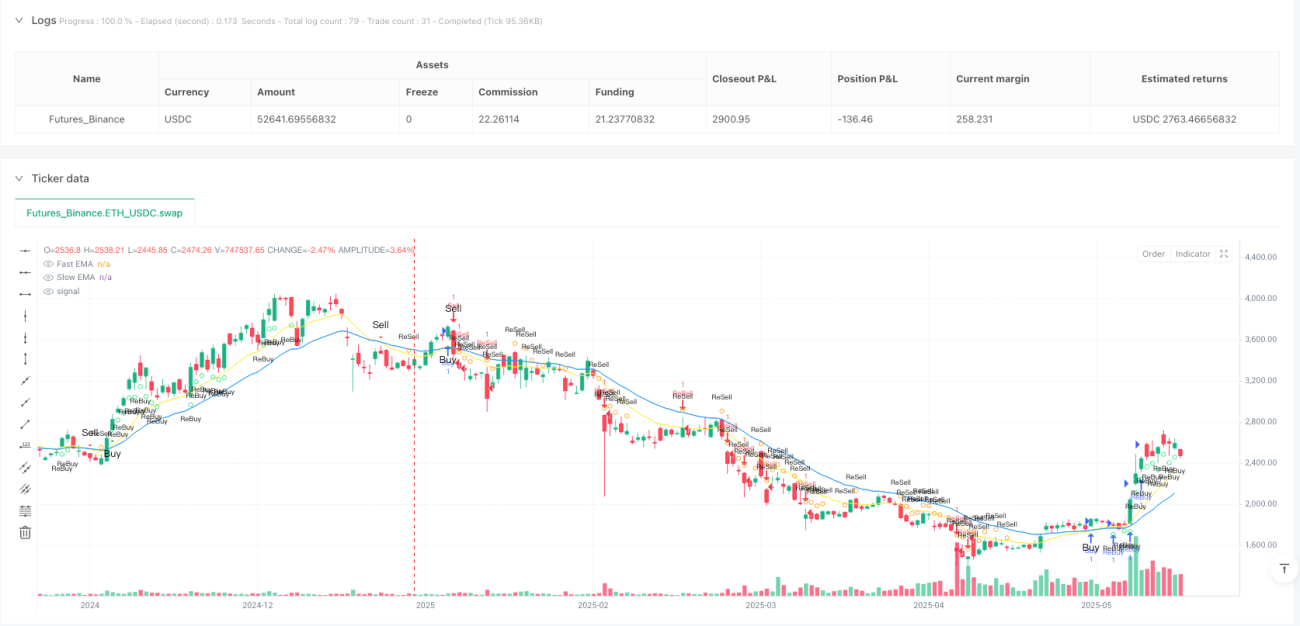
The Dual EMA Volume-Confirmed High-Frequency Quantitative Trading Strategy is a high-frequency trading approach based on EMA (Exponential Moving Average) crossovers with volume confirmation. This strategy generates initial buy/sell signals through fast and slow EMA crossovers and creates re-entry signals at pullback points within established trends using volume confirmation. The strategy is lightweight and efficient, designed for fast-paced trading environments and particularly suitable for short-term traders across various markets.
Strategy Principles
The core logic of this strategy is based on the combined application of two EMAs with different periods and a volume threshold:
-
Trend Identification Mechanism:
- Uses a 14-period fast EMA and a 28-period slow EMA to determine market trend direction
- When the fast EMA crosses above the slow EMA, an uptrend is identified
- When the fast EMA crosses below the slow EMA, a downtrend is identified
-
Entry Signal System:
- Initial buy signal: Fast EMA crosses above slow EMA
- Initial sell signal: Fast EMA crosses below slow EMA
- Re-entry buy signal: In an uptrend, price is above fast EMA and volume exceeds the threshold
- Re-entry sell signal: In a downtrend, price is below fast EMA and volume exceeds the threshold
-
Risk Management Framework:
- Implements a 10% fixed take-profit level
- Deploys a 1% trailing stop-loss to protect accrued profits
- Re-entry mechanism triggers only when there are no open trades, preventing overtrading
-
Volume Confirmation:
- Uses the ratio of current volume to its 28-period SMA as a filter condition
- Re-entry signals are valid only when current volume exceeds a multiple (default is 1x) of its SMA
Strategy Advantages
After an in-depth analysis of the code, this strategy demonstrates the following significant advantages:
-
Rapid Response: Uses EMA rather than SMA, providing greater sensitivity to price changes, which is better suited for fast-paced trading environments.
-
Reduced False Signal Risk: Incorporates volume confirmation mechanisms to improve the quality of re-entry signals and effectively filter market noise.
-
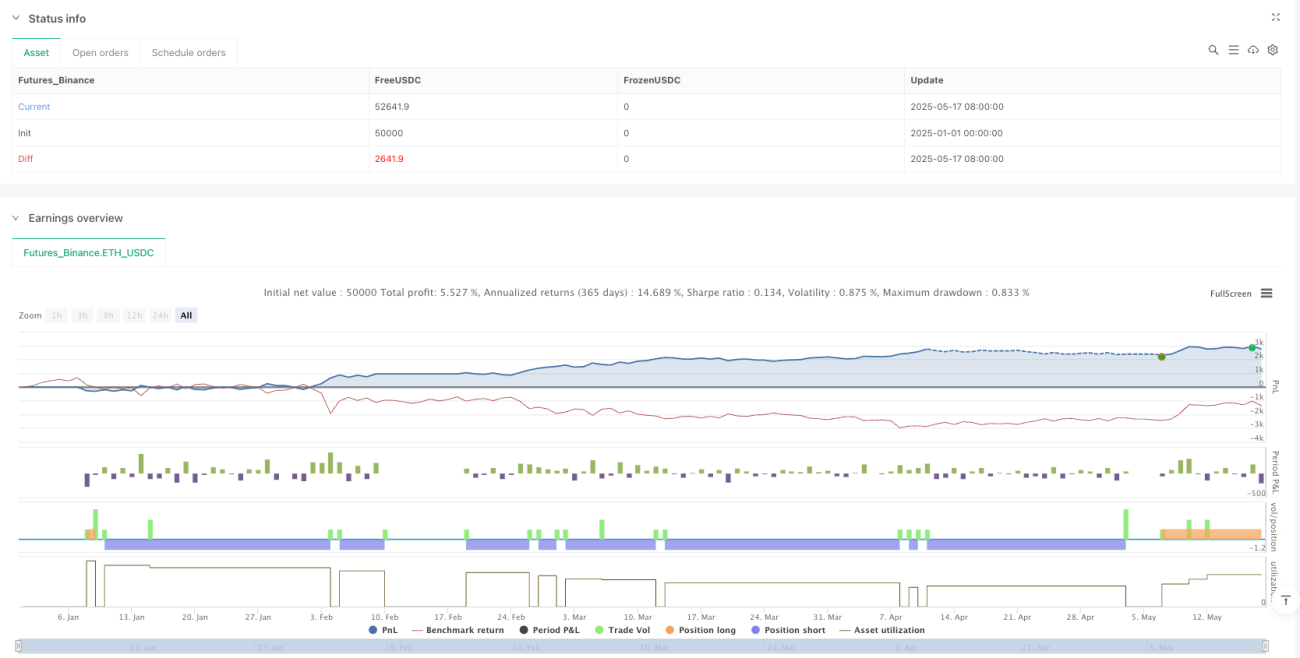
Flexible Capital Management: Adopts position sizing based on account equity percentage, automatically adjusting trade size and reducing capital management risk.
-
Multi-dimensional Risk Control: Simultaneously uses fixed take-profit and trailing stop-loss, balancing profit targets with protection of existing gains.
-
Trend Re-entry Mechanism: Allows traders to find high-probability entry points during trend continuation even after missing the initial signal.
-
Visualized Trading Signals: Clearly displays various trading signals through markers of different shapes and colors, enhancing strategy readability.
-
Automation Support: Features built-in alert conditions and message formats, facilitating integration with Webhook for trade automation.
Strategy Risks
Despite its sophisticated design, the strategy still presents the following potential risks:
-
Rapid Reversal Risk: In highly volatile markets, EMA crossovers may lag, resulting in late entries or delayed stop-loss triggers during market reversals.
- Solution: Consider adding a volatility filter to adjust parameters or pause trading when volatility is abnormally high.
-
Overtrading Risk: In ranging markets, EMAs may cross frequently, generating excessive trading signals.
- Solution: Add longer-term trend confirmation indicators or pause trading in sideways markets.
-
Fixed Parameter Failure Risk: Fixed EMA periods and take-profit/stop-loss ratios may not be suitable for all market environments.
- Solution: Implement adaptive parameter adjustment mechanisms that dynamically adjust based on market volatility.
-
Volume Anomaly Impact: Reliance on volume confirmation may fail in certain low-liquidity markets or during periods of abnormal trading volume.
- Solution: Consider adding additional volume analysis indicators such as OBV or volume volatility indicators.
-
Single Technical Indicator Dependency: Excessive reliance on EMA crossovers may ignore other important market signals.
- Solution: Integrate other technical indicators such as RSI or MACD to build a multi-factor trading model.
Strategy Optimization Directions
Based on the code analysis, the strategy can be optimized in the following directions:
-
Parameter Adaptive Mechanism:
- Implement dynamic adjustment of EMA parameters based on market volatility, automatically optimizing parameters in different volatility environments.
- Reason: Fixed parameters perform differently across market environments; adaptive parameters can improve strategy stability.
-
Multi-timeframe Analysis:
- Integrate longer-term trend confirmation and execute trades only in the direction of the major trend.
- Reason: Multi-timeframe confluence can significantly improve trading success rates and reduce false signals in ranging markets.
-
Advanced Stop-Loss Mechanism:
- Implement ATR-based dynamic stop-losses to replace fixed percentage stops.
- Reason: Market volatility varies greatly across different periods; ATR stops better adapt to market conditions.
-
Entry Optimization:
- Add price action pattern recognition, such as support/resistance breakout confirmation.
- Reason: Pure indicator crossovers may lag; combining with price action can improve entry timing precision.
-
Market State Classification:
- Implement market state recognition (trending, ranging, violent fluctuation) and use different parameter settings for different market states.
- Reason: Strategy performance varies significantly across different market states; targeted optimization can significantly enhance overall performance.
-
Volume Analysis Enhancement:
- Add volume pattern analysis, such as increasing volume to confirm trend strength.
- Reason: The current simple volume threshold may ignore important volume structure information.
Summary
The Dual EMA Volume-Confirmed High-Frequency Quantitative Trading Strategy is an elegantly designed EMA crossover system that enhances signal quality through volume confirmation. The strategy excels in trend following and re-entry signals, and implements relatively comprehensive risk management through fixed take-profit and trailing stop-loss mechanisms.
The strategy's most prominent feature is the combination of initial trend entry and intra-trend re-entry mechanisms, allowing traders to capture profit opportunities at multiple price points within the same trend. Additionally, its lightweight design and built-in alert system make it highly suitable for rapid trading and integration with automated systems.
However, to achieve consistent and stable results in actual trading, the strategy needs parameter optimization for different market environments and should consider adding adaptive mechanisms and multi-indicator confirmation. Particularly in highly volatile and sideways markets, additional filtering conditions would help reduce false signals and overtrading risk.
Overall, this is a full-featured, logically clear short-term trading strategy suitable for experienced traders to further optimize and apply in practice.
- 1