
Overview
The Dynamic Pivot Breakout Trend Following Strategy is a comprehensive quantitative trading strategy that integrates core concepts from three legendary trading masters: Jesse Livermore's pivot breakout techniques, Ed Seykota's trend confirmation methods, and Paul Tudor Jones' risk management principles. The strategy identifies key price breakout points and combines multiple confirmation mechanisms to execute precise entries at high-probability trading opportunities. The core philosophy centers on waiting for price to break through recent critical pivot points while simultaneously requiring trend direction, moving average positioning, and volume conditions to align, ensuring signal reliability. Through dynamic ATR (Average True Range) management of stop losses and trailing stops, the strategy maximizes profit potential while maintaining strict risk control.
Strategy Mechanics
The strategy operates on a multi-layered technical analysis framework. Initially, it employs pivot highs and lows to identify key support and resistance levels, which often represent significant psychological price points in the market. When price breaks through these critical levels, it frequently signals the beginning of new trends or continuation of existing ones. For long signals, the strategy requires closing price to break above recent pivot highs with price positioned above the 50-period EMA, while the 20-period EMA must exceed the 200-period EMA to confirm upward trend momentum. Volume confirmation mechanisms demand current volume to surpass the 20-period volume moving average, indicating sufficient market participation behind the breakout. Short signal logic operates inversely, requiring price to break below pivot lows, position below the main EMA, downward trend confirmation, and accompanying volume expansion. The stop-loss mechanism utilizes 3x ATR as initial stop distance, while trailing stops employ 2x ATR as offset distance, ensuring dynamic adjustment and effective risk control across varying market conditions.
Strategy Advantages
This strategy demonstrates multiple significant advantages. Firstly, the multi-confirmation mechanism substantially enhances trading signal accuracy, avoiding false signals that single indicators might generate. Pivot breakouts combined with trend confirmation and volume validation create a comprehensive signal filtering system. Secondly, the dynamic ATR risk management system automatically adjusts stop-loss and trailing stop levels according to market volatility, providing adaptive risk control effectiveness across different market environments. The strategy's trend-following characteristics enable it to capture major market movements, while trailing stop mechanisms help lock in profits and allow winners to run. Additionally, the strategy incorporates the essential philosophies of three trading masters, providing deep theoretical foundation and practical validation. Volume confirmation mechanisms ensure breakout validity, avoiding false breakout traps. The strategy's parameterized design enables adaptation to different market conditions and trading instruments.
Strategy Risks
Despite careful design, several potential risks require attention. Firstly, in choppy markets, the strategy may encounter frequent false breakouts, leading to consecutive small losses. While multiple confirmation mechanisms help reduce this occurrence, they cannot completely eliminate it. Secondly, the strategy relies on trending market existence and may underperform during extended sideways consolidation phases. Pivot point identification carries inherent lag, potentially missing early trend opportunities. ATR-based stops may prove too wide or too tight in extremely volatile markets. The strategy's multiple condition requirements may cause missed valid trading opportunities, particularly in rapidly changing markets. Parameter sensitivity also requires consideration, as inappropriate settings may impact strategy performance. To mitigate these risks, comprehensive backtesting across different market environments, parameter optimization, and consideration of combining with other strategies for risk diversification are recommended.
Optimization Directions
The strategy presents multiple optimization avenues for performance enhancement. Firstly, implementing adaptive parameter systems that dynamically adjust EMA periods and ATR multipliers based on market volatility and trend strength would enable better adaptation to varying market environments. Secondly, adding market regime identification modules to distinguish trending from ranging markets and apply different trading logic accordingly. Volume analysis can be further refined through volume-price trend analysis or relative volume indicators. Consider incorporating additional technical indicators for auxiliary confirmation, such as RSI, MACD, or Bollinger Bands. For risk management, implementing scaling-in and scaling-out mechanisms or dynamically adjusting position sizes based on account equity. Furthermore, developing multi-timeframe analysis capabilities to confirm trend direction on higher timeframes while seeking precise entry points on lower timeframes. Machine learning application represents a promising direction for parameter optimization or signal prediction enhancement.
Conclusion
The Dynamic Pivot Breakout Trend Following Strategy represents a comprehensive and theoretically sound quantitative trading approach. It successfully combines classical technical analysis concepts with modern risk management techniques, creating a relatively complete trading system. The strategy's multiple confirmation mechanisms, dynamic risk management, and trend-following characteristics provide good profit potential in suitable market environments. However, traders should fully understand its limitations, particularly performance in choppy markets. Through continuous optimization and improvement, this strategy holds significant potential in quantitative trading applications. Successful implementation depends on thorough backtesting validation, reasonable parameter settings, and deep market environment understanding.
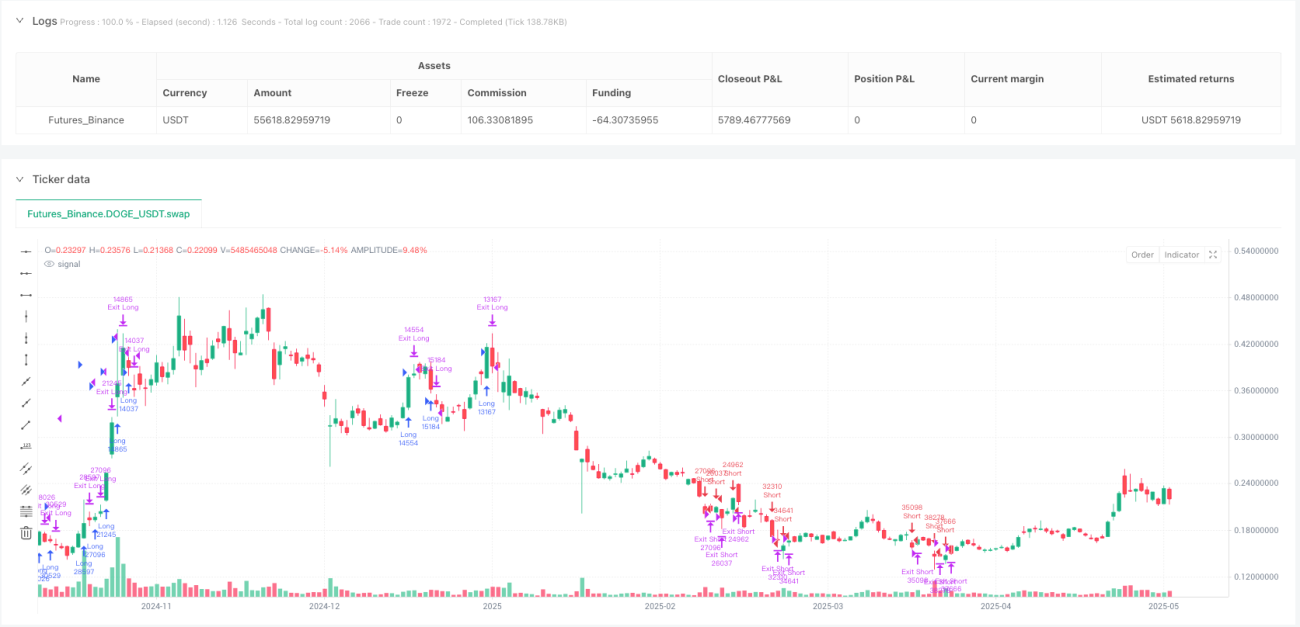
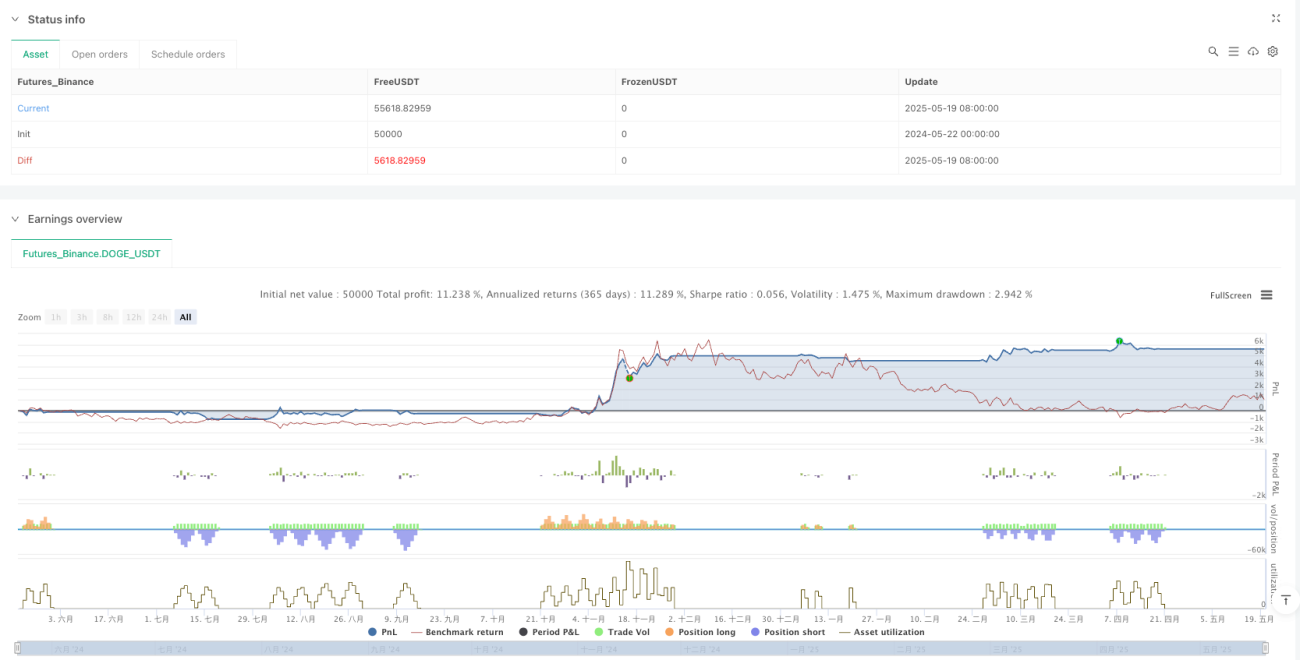
/*backtest
start: 2024-05-22 00:00:00
end: 2025-05-20 08:00:00
period: 1d
basePeriod: 1d
exchanges: [{"eid":"Futures_Binance","currency":"DOGE_USDT"}]
*/

//@version=6
strategy("Livermore-Seykota Breakout Strategy", overlay=true, pyramiding=0, default_qty_type=strategy.percent_of_equity, default_qty_value=10)

// ----- Inputs ------ 1