
Overview
This strategy is a bidirectional short-term trading strategy based on Exponential Moving Average (EMA) crossovers and Relative Strength Index (RSI) filtering. The strategy combines crossover signals from fast EMA (9-period) and slow EMA (21-period) with RSI indicators as entry filtering conditions to capture short-term price fluctuation opportunities within specific time windows. The strategy employs fixed percentage stop-loss and take-profit settings, aiming to accumulate returns through high-frequency small profits. This strategy is suitable for markets with sufficient liquidity, particularly during active periods in Asian trading sessions.
Strategy Principle
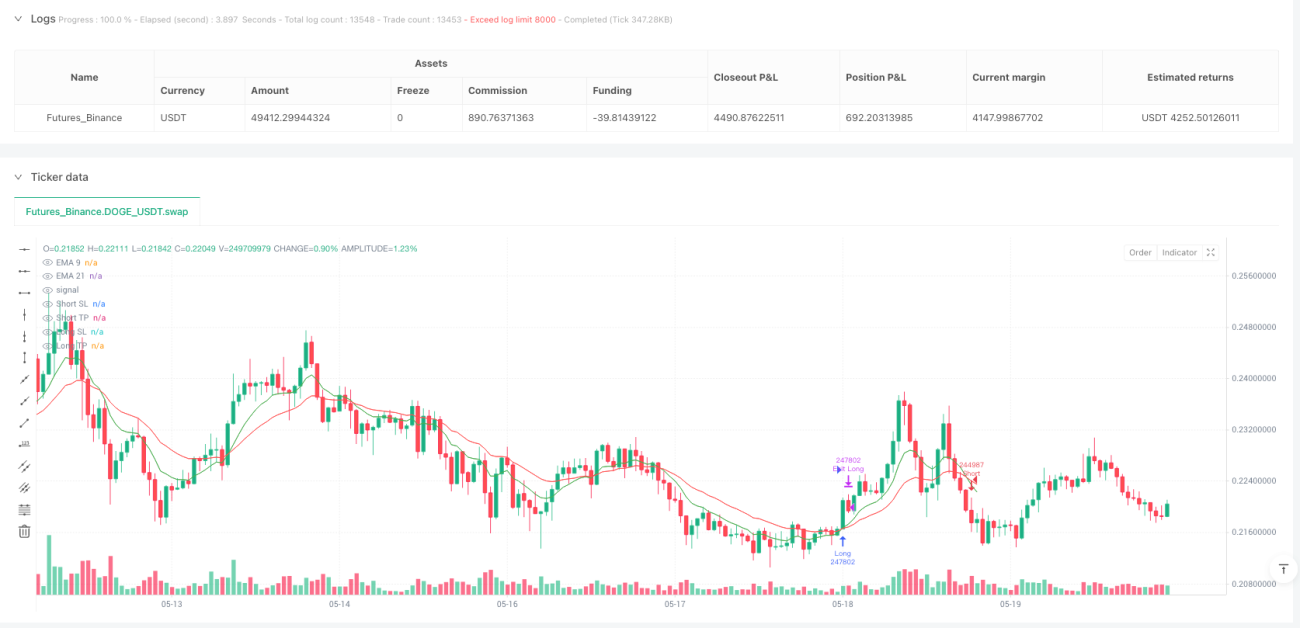
The core logic of the strategy is based on the classic moving average crossover theory and momentum indicator confirmation mechanism in technical analysis. When the fast EMA (9-period) crosses above the slow EMA (21-period), it indicates that short-term price momentum is turning upward. If the RSI value is greater than 50 at this time, it shows that the market has sufficient upward momentum, satisfying the long condition. Conversely, when the fast EMA crosses below the slow EMA, combined with the condition that the RSI value is less than 50, it confirms the validity of the downward trend and triggers a short signal.
The time filtering mechanism is set for Asian timezone from 9:15 AM to 3:30 PM, a period that typically has high market activity and liquidity. After entry, the strategy adopts a fixed percentage risk management approach: stop-loss is set at 0.5% of the entry price, and take-profit is set at 1.0% of the entry price, forming a 1:2 risk-reward ratio. This setting ensures positive expected returns in the long term, even with a 50% win rate.
Trade execution adopts an immediate entry mode. Once signals are confirmed, the system automatically places orders and simultaneously sets stop-loss and take-profit orders. Visualization components display current position stop-loss and take-profit levels on the chart, helping traders monitor risk status in real-time.
Strategy Advantages
This strategy has multiple technical advantages, primarily reflected in the reliability of signal generation. EMA crossover, as a classic trend-following method, can effectively identify changes in price momentum, while the addition of RSI indicators provides additional momentum confirmation, reducing the risk of false breakouts. The dual confirmation mechanism significantly improves signal accuracy and trading success probability.
In terms of risk management, the strategy uses preset percentage stop-loss and take-profit, avoiding subjective judgment interference and ensuring controllable risk for each trade. The 1:2 risk-reward ratio design allows the strategy to maintain positive expected returns even with relatively low win rates, which is crucial for long-term stable profitability.
The time filtering function is another important advantage. By limiting trading hours to active market periods, it effectively avoids slippage risks and execution difficulties during periods of insufficient liquidity. The choice of Asian sessions considers the specificity of markets in this timezone, which typically have relatively stable volatility and sufficient trading opportunities.
The strategy has a high degree of automation, reducing human emotional interference and ensuring consistency and objectivity in trading decisions. Additionally, the strategy is applicable to bidirectional trading, capable of capturing profit opportunities in both rising and falling markets, improving capital utilization efficiency and profit potential.
Strategy Risks
Despite the relatively comprehensive strategy design, several risks require focused attention. First is market environment risk. In oscillating markets or periods lacking clear trends, EMA crossover signals may frequently generate false signals, leading to consecutive small losses. Particularly during sideways consolidation phases, fast and slow EMAs may cross repeatedly, producing excessive invalid signals.
Fixed percentage stop-loss and take-profit settings, while simplifying risk management, lack adaptability to market volatility. In high volatility environments, a 0.5% stop-loss may be too tight and easily triggered by normal price noise; in low volatility environments, a 1.0% take-profit target may be too optimistic and difficult to achieve.
RSI indicators have lagging issues and may not timely reflect changes in price momentum in rapidly changing markets. Additionally, RSI tends to become overbought/oversold in trending markets, potentially missing optimal entry opportunities at the beginning of trends.
Time filtering limits strategy applicability and may miss quality trading opportunities in other time periods. Meanwhile, fixed trading time settings do not consider differences in optimal trading times under different market environments.
Liquidity risk cannot be ignored either. In situations of insufficient market liquidity, there may be risks of increased slippage and execution price deviation, affecting actual strategy performance.
Strategy Optimization Directions
Targeting the limitations of the existing strategy, improvements can be made from multiple dimensions. First, it is recommended to introduce adaptive parameter mechanisms that dynamically adjust EMA period lengths and RSI thresholds based on market volatility. The ATR (Average True Range) indicator can be used to measure market volatility, extending EMA periods during high volatility to reduce noise and shortening periods during low volatility to improve sensitivity.
The stop-loss and take-profit mechanism should change from fixed percentages to dynamic settings based on ATR. It is recommended to set stop-loss at 1-2 times ATR and take-profit at 2-3 times ATR, better adapting to volatility characteristics of different market environments and improving strategy robustness.
Additional technical indicator confirmations can be added, such as volume indicators or volatility indicators, forming a more comprehensive multiple confirmation system. For example, requiring breakouts to be accompanied by volume expansion or price breakouts of Bollinger Bands, further improving signal quality.
Implementing staged entry and exit mechanisms is recommended, breaking single trades into multiple smaller orders to reduce single trade risk while capturing more profits when trends continue. For instance, 50% position can be entered after initial signal confirmation, with remaining position added after price further confirms the trend.
Time filtering mechanisms can be more intelligent, determining optimal trading time windows based on historical data analysis and dynamically adjusting according to changing market conditions. Consideration can also be given to adding avoidance mechanisms for important economic data release times, reducing fundamental impact.
Finally, it is recommended to add trend strength assessment mechanisms, appropriately relaxing entry conditions in strong trend markets and raising entry thresholds in weak trend or oscillating markets, achieving adaptive strategy adjustment.
Summary
The Short-term EMA-RSI Bidirectional Crossover Mean Reversion Strategy constructs a relatively complete short-term trading framework by combining moving average crossovers and momentum indicator confirmation. The strategy performs excellently in signal generation, risk control, and execution efficiency, particularly suitable for high-frequency trading operations during active market periods. Fixed risk-reward ratio settings ensure long-term profitability of the strategy, while bidirectional trading mechanisms improve market adaptability.
However, the strategy still has room for improvement in parameter rigidity, market adaptability, and risk control refinement. Through introducing adaptive mechanisms, optimizing stop-loss and take-profit logic, and improving signal confirmation systems, the overall performance and market adaptability of the strategy can be significantly enhanced.
For traders using this strategy, it is recommended to conduct thorough historical backtesting and simulated trading before live application, optimizing parameters according to specific trading instruments and market environments. Meanwhile, close attention should be paid to strategy performance under different market conditions, with timely adjustments and improvements to strategy settings to ensure the strategy can maintain stable profitability across various market environments.
/*backtest
start: 2025-01-01 00:00:00
end: 2025-05-21 00:00:00
period: 1h
basePeriod: 1h
exchanges: [{"eid":"Futures_Binance","currency":"DOGE_USDT"}]
*/

//@version=5
strategy("Scalping EMA + RSI Strategy (Long & Short)", overlay=true, default_qty_type=strategy.percent_of_equity, default_qty_value=100)

// === INPUTS ===- 1