Multi-Filter RSI Momentum Confirmation Trading Strategy

Overview
The Multi-Filter RSI Momentum Confirmation Trading Strategy is a systematic trading approach specifically designed for cryptocurrency markets. This strategy combines RSI momentum signals with volume confirmation and precise candlestick pattern recognition to identify high-probability entry points while filtering out weak signals. The strategy implements a multi-layered filtering system that requires several conditions to align before entering a trade, aiming to capture only the most reliable trade setups by requiring RSI momentum shifts, significant volume, and strong candle patterns.
The core strength of this strategy lies in the powerful combination of its multi-confirmation approach. RSI identifies potential momentum shifts but can produce false signals in ranging markets, volume confirmation ensures trades are only taken when sufficient market interest exists, and candlestick pattern requirements filter out weak reversals by demanding decisive price action. When these three filters work together, they significantly reduce false signals while capturing strong momentum shifts. The strategy also incorporates built-in risk management features that provide automatic stop-loss and take-profit placement based on either ATR volatility or fixed percentage risk.
Strategy Principles
The core logic of this strategy is built upon the synergistic interaction of three primary technical indicators. First is the RSI momentum detection mechanism, where the strategy employs a 14-period RSI indicator with 70 set as the overbought level and 30 as the oversold level. For long entries, the system detects RSI crossing above 30 from below, indicating a transition from oversold conditions to bullish momentum. For short entries, the system identifies RSI crossing below 70 from above, signaling a shift from overbought conditions to bearish momentum.
The second critical component is the volume confirmation system. The strategy requires that the current candle's volume must exceed the 14-period simple moving average of volume, ensuring that trades are executed only when there is sufficient market participation, thereby filtering out false breakouts in low-liquidity environments. The third filter is candlestick pattern analysis, requiring strong bullish or bearish candles where the body comprises at least 50% of the total candle range, ensuring that price action has decisive characteristics and avoiding weak signals during uncertain market conditions.
The strategy also provides an optional Supertrend filter that, when enabled, requires long entries to align with the upward direction of the Supertrend and short entries to align with the downward trend. The dynamic ATR stop-loss system adjusts protection levels based on current market volatility, using a 3.5x ATR multiplier to calculate stop-loss and profit targets, or providing an option for a fixed 0.5% stop-loss with a risk-reward ratio set at 1.5:1.
Advantages Analysis
The Multi-Filter RSI Momentum Confirmation Trading Strategy offers several significant advantages. First is its powerful signal filtering capability, where by requiring three conditions to be met simultaneously - RSI momentum transition, volume confirmation, and strong candlestick patterns - the strategy dramatically reduces the probability of false signals. This multi-confirmation mechanism ensures that trades are executed only when the market shows genuine signs of momentum transition, thereby improving the success rate of trades.
Second, the strategy demonstrates excellent adaptability and flexibility. The dynamic ATR stop-loss system can automatically adjust protection levels based on market volatility, providing looser stops during high volatility periods and tightening protection during low volatility periods. This adaptive characteristic allows the strategy to maintain effectiveness across different market conditions. The optional Supertrend filter provides traders with an additional trend confirmation tool, further enhancing signal quality.
The third important advantage is the comprehensive risk management system. The strategy offers two exit methods - ATR-based dynamic stops and fixed percentage stops - allowing traders to choose the appropriate method based on their risk preferences. The 1.5:1 risk-reward ratio setting ensures a favorable break-even point, maintaining profitability even with slightly lower win rates. The strategy also supports multiple trading direction configurations, including long-only, short-only, or bidirectional trading.
Risk Analysis
Despite the strategy's multiple filtering mechanisms, several potential risks require attention. The primary risk is missing trading opportunities in strong trending markets. Since the strategy relies on RSI overbought and oversold signals, during sustained uptrends or downtrends, RSI may remain at extreme levels for extended periods, preventing the strategy from generating entry signals and thus missing important trend opportunities. The solution involves combining higher timeframe trend analysis or adjusting RSI parameters to suit specific market conditions.
The second significant risk is frequent trading in ranging markets. While multiple filters reduce false signals, during sideways consolidation phases, the market may still generate multiple seemingly valid but ultimately failed breakout signals. This could lead to the accumulation of consecutive small losses. Mitigation strategies include adding additional market state filters, such as volatility indicators or trend strength indicators, to pause trading during low-trend environments.
The third risk involves parameter optimization overfitting. The strategy contains multiple adjustable parameters, including RSI length, ATR period, risk-reward ratio, and others. Over-optimizing these parameters to fit historical data may lead to poor future performance. It is recommended to use robust parameter settings, conduct regular out-of-sample testing, and avoid over-optimization based on limited historical data. Additionally, transaction costs and slippage can significantly impact strategy performance in high-frequency trading environments, particularly when operating on smaller timeframes.
Optimization Directions
The strategy has several important optimization directions. First is enhancing market state identification capabilities by integrating additional market classification indicators such as Average True Range ratios, volatility indices, or trend strength indicators to better identify different market environments. In high volatility environments, the strategy could adjust RSI thresholds or add additional confirmation conditions; in low volatility environments, parameters could be tightened to improve signal sensitivity. This adaptive parameter adjustment would significantly improve strategy performance across different market conditions.
The second optimization direction is implementing multi-timeframe analysis. The current strategy primarily operates on a single timeframe, but by integrating higher timeframe trend confirmation, signal quality can be significantly improved. For example, when executing the strategy on a 5-minute chart, trend direction alignment on 15-minute or 1-hour charts could be required. This approach would reduce the frequency of counter-trend trades and improve overall win rates.
The third key optimization is implementing a dynamic position management system. The current strategy uses a fixed risk-reward ratio, but position size and targets could be dynamically adjusted based on market volatility, signal strength, or historical performance. Increasing position size during high-confidence signals and reducing it during higher uncertainty periods would maximize capital efficiency.
The fourth optimization direction is integrating machine learning components. Historical data could be used to train models to identify optimal entry condition combinations or predict the probability of signal success. This approach could dynamically adjust strategy parameters based on current market conditions rather than relying on static settings.
Summary
The Multi-Filter RSI Momentum Confirmation Trading Strategy represents a sophisticated quantitative trading approach that creates a powerful trading system through the clever combination of technical indicators, volume analysis, and risk management. The strategy's core advantage lies in its multi-layered filtering mechanism, effectively reducing false signals while maintaining sensitivity to genuine market opportunities. The dynamic ATR stop-loss system and flexible parameter configuration enable it to adapt to different market environments and trading preferences.
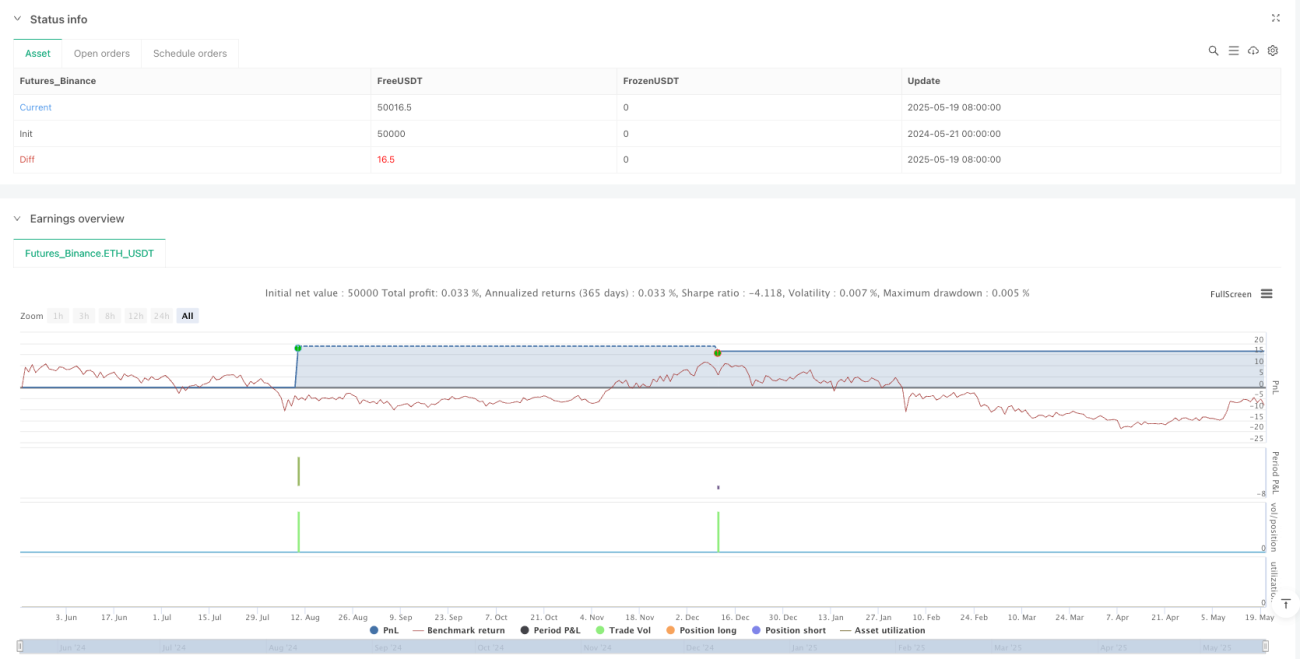
The strategy's backtest results on the BTCUSDT 5-minute chart demonstrate solid performance, with a 58.49% win rate, 1.472 profit factor, and only 3.01% maximum drawdown proving the effectiveness of its risk-adjusted returns. However, traders must recognize that any strategy has inherent risks, particularly in the rapidly changing cryptocurrency markets.
Successful implementation of this strategy requires continuous monitoring, regular parameter evaluation, and adaptive adjustments to changing market conditions. Through the suggested optimization directions, particularly multi-timeframe analysis and dynamic parameter adjustment, the strategy has tremendous potential for further performance enhancement. Ultimately, this strategy provides a solid foundation for traders seeking a systematic approach to cryptocurrency trading, but should always be combined with appropriate risk management and continuous learning.
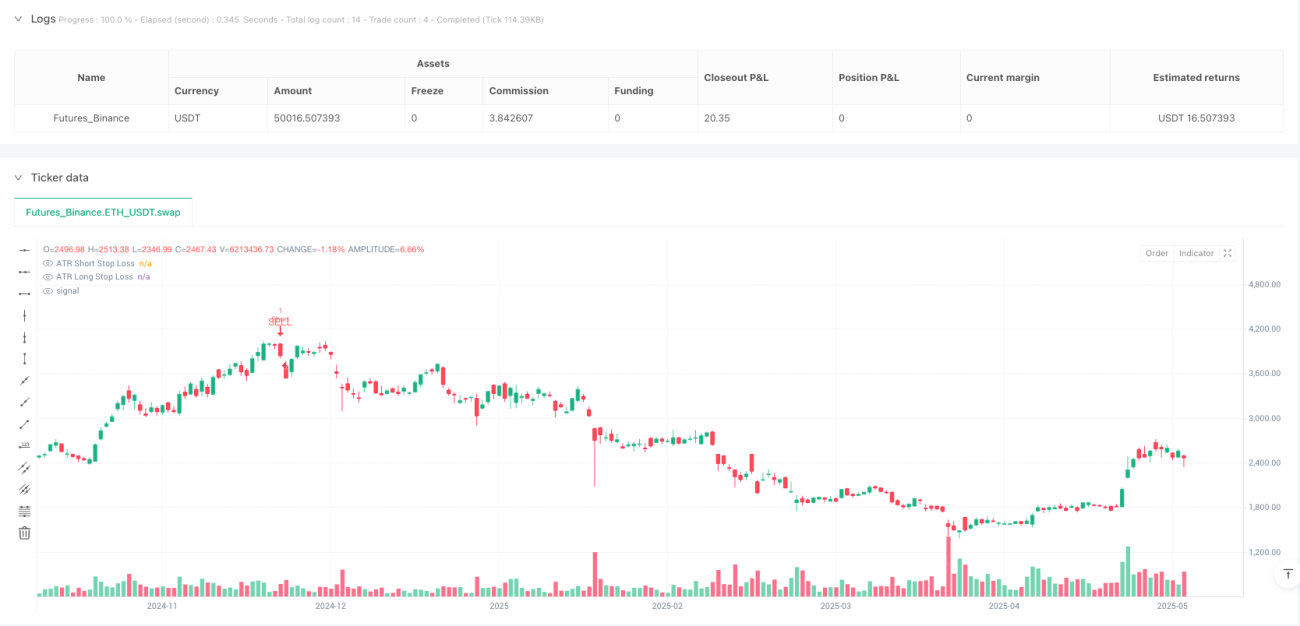
/*backtest
start: 2024-05-21 00:00:00
end: 2025-05-20 08:00:00
period: 1d
basePeriod: 1d
exchanges: [{"eid":"Futures_Binance","currency":"ETH_USDT"}]
*/

// This Pine Script™ code is subject to the terms of the Mozilla Public License 2.0 at https://mozilla.org/MPL/2.0/
// © nioboi

// Best settings already at default. - 1