
Overview
The Multi-Structure Price Resonance Quantitative Strategy is a sophisticated high-frequency trading approach based on market microstructure analysis, specifically designed to capture high-probability trading opportunities generated by the convergence of Order Blocks (OB) and Fair Value Gaps (FVG). This strategy identifies the simultaneous occurrence of these two critical price structures and executes precise entry and exit operations during New York trading sessions, employing a fixed 2:1 risk-reward ratio to optimize capital management efficiency.
The core philosophy of this strategy is grounded in market liquidity theory and price action analysis. When Order Blocks and Fair Value Gaps overlap within the same timeframe, it typically signifies institutional participation and market imbalance correction, providing strong directional guidance for short-term price movements. By restricting trading activities to New York's primary trading sessions, the strategy maximizes the utilization of liquidity advantages during active market periods while avoiding potential price anomalies during low-liquidity sessions.
Strategy Mechanism
The operational framework of this strategy is built upon the synergistic interaction of two core technical indicators. First is the Order Block identification mechanism, which analyzes the price relationships of three consecutive candlesticks to determine market structural pivot points. For bullish Order Blocks, the system detects whether the previous two candlesticks form bearish patterns (closing price below opening price), followed by subsequent candlesticks showing gradual upward momentum, indicating diminishing selling pressure and emerging buyer dominance. Conversely, bearish Order Blocks are confirmed through identifying bullish patterns in the previous two candlesticks followed by gradual price decline, establishing seller control.
Fair Value Gap identification is based on price gap theory. When the current candlestick's low exceeds the high of the candlestick two periods prior, a bullish Fair Value Gap forms, reflecting strong market demand for higher price levels. When the current candlestick's high falls below the low of the candlestick two periods prior, a bearish Fair Value Gap emerges, suggesting intensified market selling pressure. These price gaps typically represent market liquidity imbalances that require subsequent price movements for correction.
Trade signal generation requires the simultaneous satisfaction of three conditions: formation of an Order Block in the corresponding direction, appearance of a Fair Value Gap in the same direction, and current time falling within New York trading sessions. The selection of New York sessions is based on the high liquidity and active institutional trading activities in US markets during these periods, providing more reliable price discovery mechanisms and lower slippage costs.
Strategy Advantages
The Multi-Structure Price Resonance Strategy demonstrates significant market adaptability advantages. By combining two different dimensions of technical analysis tools, the strategy maintains high signal quality and accuracy in complex market environments. Order Block analysis focuses on identifying behavioral patterns of market participants, while Fair Value Gap analysis concentrates on price structure discontinuities. Their combination provides a more comprehensive market perspective for trading decisions.
The time filtering mechanism represents another crucial advantage of this strategy. By restricting trading activities to New York's primary trading sessions, the strategy effectively avoids potential liquidity insufficiency issues in Asian and European markets while circumventing the market dormancy period during US lunch hours. This temporal selectivity not only enhances trading execution efficiency but also significantly reduces the risk of price anomalies caused by insufficient liquidity.
The design of risk control mechanisms reflects the strategy's professionalism and practicality. The fixed 2:1 risk-reward ratio ensures profitability even with success rates as low as 40%, providing mathematical assurance for long-term stable returns. Stop-loss positioning based on key price levels effectively controls maximum loss per trade, while target calculations ensure sufficient profit margins to cover trading costs and potential consecutive losses.
The automated characteristics of the strategy eliminate emotional interference in trading decisions, ensuring execution consistency and objectivity. All entry, exit, and risk management operations are based on preset quantitative rules, avoiding biases and delays that subjective judgment might introduce.
Strategy Risks
Despite multiple advantages, this strategy faces several potential market risks. The primary risk stems from rapid market structural changes and unexpected event impacts. When markets experience extreme volatility, traditional technical analysis patterns may fail, causing Order Block and Fair Value Gap signals to become misleading. This is particularly evident during major economic data releases, central bank policy announcements, or geopolitical events when markets may exhibit abnormal volatility beyond historical patterns.
Liquidity risk represents another critical concern. Although the strategy operates during New York trading sessions, under certain special circumstances (such as around holidays or during significant news releases), market liquidity may still decline substantially, leading to increased slippage and execution difficulties. In such situations, actual trading results may differ significantly from backtesting data.
The lag inherent in technical indicators also poses certain challenges. Both Order Block and Fair Value Gap identification require complete candlestick formation, meaning the strategy naturally exhibits certain delays. In rapidly changing market environments, such delays may result in missing optimal entry opportunities or forced entries at unfavorable positions.
Overfitting risk cannot be overlooked. The strategy is constructed based on historical price patterns and may overly depend on past market behavioral characteristics. If market structures undergo fundamental changes or other market participants begin extensively using similar strategies, original price patterns may become ineffective, leading to significant strategy performance degradation.
Strategy Optimization Directions
To enhance strategy robustness and adaptability, consideration should be given to introducing dynamic risk management mechanisms. While the current fixed 2:1 risk-reward ratio is simple and effective, it fails to account for changing market volatility. By incorporating ATR (Average True Range) or other volatility indicators, stop-loss and take-profit levels can be dynamically adjusted based on current market conditions, expanding stop-loss ranges during high volatility periods to avoid normal market noise stops while tightening stops during low volatility periods to improve capital efficiency.
The introduction of multi-timeframe analysis would significantly enhance the strategy's predictive capabilities. Currently, the strategy operates based solely on single timeframe analysis, making it susceptible to short-term market noise interference. By confirming trend directions on higher timeframes and seeking specific entry points on lower timeframes, signal quality and reliability can be substantially improved. For example, requiring clear trend direction on daily charts before seeking Order Block and Fair Value Gap combinations on hourly or minute charts.
Integrating market sentiment and volume analysis would add new dimensions to the strategy. Current strategy focus solely on price action while ignoring volume as an important confirmation indicator. Requiring abnormal volume accompaniment during Order Block formation can enhance signal credibility. Additionally, incorporating VIX and other market fear indicators can suspend trading during extreme market panic or greed, avoiding losses in irrational market environments.
Machine learning technology applications would provide entirely new possibilities for strategy optimization. By using deep learning models to analyze vast amounts of historical data, complex patterns undetectable through traditional technical analysis can be identified. Particularly in feature engineering, multi-dimensional feature vectors including price, volume, market microstructure, and macroeconomic indicators can be constructed to train more precise market prediction models.
Conclusion
The Multi-Structure Price Resonance Quantitative Strategy represents a successful fusion of modern quantitative trading technology with traditional technical analysis theory. Through ingeniously combining Order Block identification and Fair Value Gap analysis, this strategy maintains high trading signal quality while achieving effective risk control and stable profit generation. The New York trading session time filter mechanism and fixed 2:1 risk-reward ratio provide a solid foundational framework for the strategy.
However, the complexity and continuously evolving characteristics of financial markets demand that strategies possess continuous improvement capabilities. Through introducing dynamic risk management, multi-timeframe analysis, market sentiment integration, and machine learning technologies, this strategy has the potential to maintain competitive advantages and sustained profitability in future market environments.
Successful quantitative trading strategies require not only solid theoretical foundations and rigorous execution mechanisms but also continuous validation, adjustment, and optimization in actual trading. The Multi-Structure Price Resonance Strategy provides traders with an excellent starting point, but ultimate success will still depend on users' deep market understanding and continuous strategy refinement.
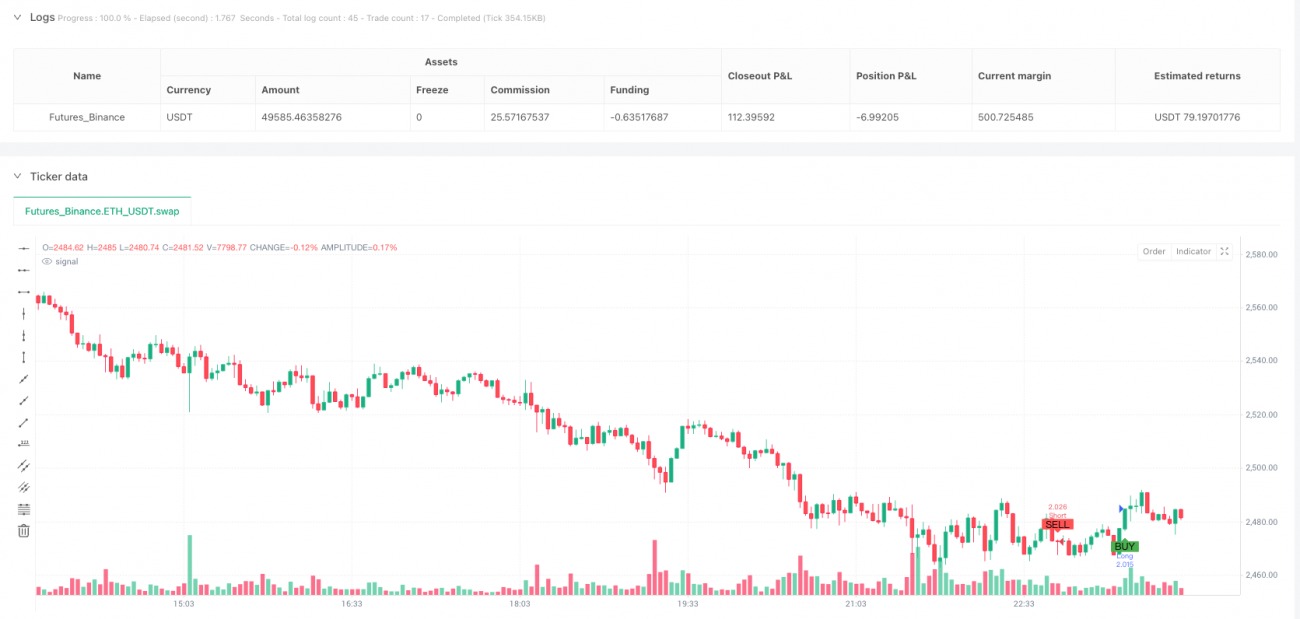
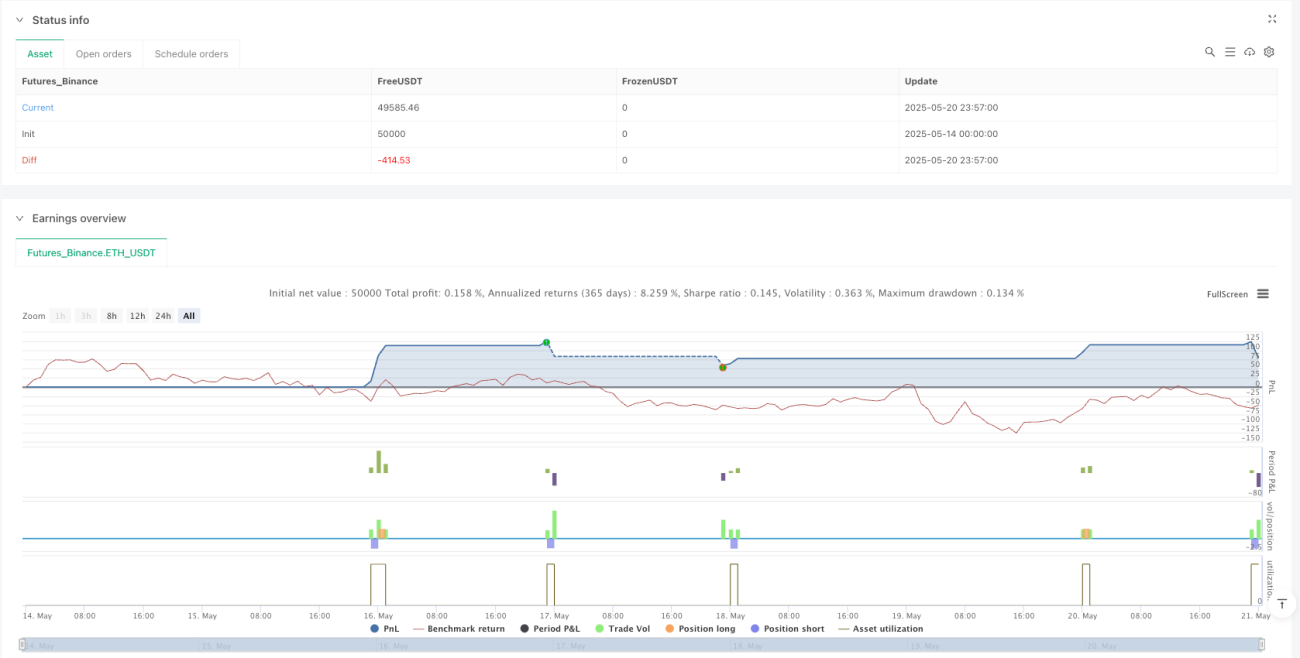
/*backtest
start: 2025-05-14 00:00:00
end: 2025-05-21 00:00:00
period: 3m
basePeriod: 3m
exchanges: [{"eid":"Futures_Binance","currency":"ETH_USDT"}]
*/

//@version=5
strategy("OB + FVG Strategy (No Sweep)", overlay=true, default_qty_type=strategy.percent_of_equity, default_qty_value=10)

// NY session: 09:30–12:00 and 13:30–16:00 New York time- 1