
Overview
The Multi-Technical Indicator Momentum Breakout Trading Strategy is a comprehensive quantitative trading approach that integrates multiple technical analysis tools including Relative Strength Index (RSI), Exponential Moving Averages (EMA), volume analysis, and candlestick pattern recognition to construct a comprehensive market signal identification system. The strategy employs a modular design that allows traders to selectively enable or disable specific technical indicators based on market conditions, achieving personalized trading configurations. The core philosophy centers on reducing false signals through multiple confirmation mechanisms, enhancing the accuracy and reliability of trading decisions.
Strategy Principles
The strategy's fundamental architecture is built upon four primary technical analysis dimensions. First is the trend confirmation mechanism, utilizing crossovers between 9-period and 21-period exponential moving averages to identify trend change points. When the short-term EMA crosses above the long-term EMA, it suggests the market may be entering an upward trend; conversely, it indicates the beginning of a downward trend. Second is the momentum confirmation system, employing a 14-period RSI indicator to determine market momentum direction, with RSI above 50 indicating bullish momentum dominance and below 50 showing stronger bearish forces.
Volume breakout analysis constitutes the third core element of the strategy. By calculating a 20-period simple moving average of volume and setting a 1.5x threshold, it identifies abnormal volume spikes. When actual volume exceeds 1.5 times the average, it indicates significantly increased market participation, providing crucial confirmation signals for price breakouts. Finally, the candlestick pattern recognition module specifically captures classic formations at market turning points, including engulfing patterns and pin bar reversals.
Engulfing patterns are categorized into bullish and bearish engulfing types. Bullish engulfing requires the current bullish candle to completely contain the real body of the previous bearish candle, demonstrating strong bullish intervention. Bearish engulfing is the opposite, where the current bearish candle completely covers the previous bullish candle's body, indicating increased bearish control. Pin bar reversal patterns identify extreme market sentiment expressions by analyzing the upper and lower shadow lengths of candles, with long lower shadows combined with small bodies in bullish pins suggesting exhausted selling pressure, while bearish pins with long upper shadows indicate insufficient buying power.
For risk management, the strategy employs dynamic stop-loss and take-profit design based on Average True Range (ATR). Stop-loss is set at entry price minus 1.5 times ATR value, ensuring adequate protection during increased market volatility. Take-profit targets are set at entry price plus 2.25 times ATR, achieving a 1:1.5 risk-reward ratio, establishing a foundation for long-term profitability.
Strategy Advantages
Multiple confirmation mechanisms represent one of the strategy's most significant advantages. By requiring multiple technical indicators to simultaneously meet conditions before triggering trading signals, it substantially reduces the probability of false signals generated by single indicators. This comprehensive market analysis approach can more accurately capture genuine market turning points, avoiding losses from frequent entries and exits in sideways markets.
The strategy's modular design provides traders with tremendous flexibility. Each technical indicator can be independently enabled or disabled, allowing traders to adjust strategy configurations based on different market environments and personal preferences. In trending markets, focus can be placed on EMA crossover signals; during consolidation periods, greater reliance can be placed on RSI and candlestick pattern guidance.
The adaptive risk management system is another important advantage. ATR-based stop-loss and take-profit settings can automatically adjust risk parameters according to market volatility, providing more generous stop-loss space during high volatility periods while tightening risk control in low volatility environments, ensuring risk management remains synchronized with market conditions.
Volume confirmation mechanisms enhance signal reliability. Price breakouts often require volume support to sustain, and this strategy effectively filters false breakouts lacking market participation support through volume amplification requirements, improving trading success rates.
Candlestick pattern recognition functionality adds a market psychology analysis dimension to the strategy. Both engulfing patterns and pin bar reversals are classic formations validated through long-term market experience, reflecting important changes in market participant sentiment and providing valuable psychological analysis support for the strategy.
Strategy Risks
Over-optimization risk is one of the primary challenges facing this strategy. Due to involvement of multiple technical indicators and parameter settings, there exists potential for excessive curve-fitting to historical data, leading to actual trading performance falling short of backtesting results. Solutions include conducting thorough out-of-sample testing across different time periods and market environments, along with regular parameter review and adjustment.
Signal scarcity issues may impact the strategy's trading frequency. Since multiple conditions must be simultaneously satisfied to generate trading signals, certain market environments may experience prolonged periods without signals, affecting capital utilization efficiency. It's recommended to mitigate this by appropriately relaxing certain condition strictness or adding alternative indicators.
Lag is an inherent flaw in technical analysis strategies. All technical indicators are calculated based on historical price data, creating certain lag that may result in missing optimal entry timing or generating signals at trend endpoints. This can be mitigated by combining more sensitive short-term indicators or incorporating market sentiment analysis.
Market environment adaptability risk requires focused attention. The strategy performs well in trending markets but may be less effective in extremely volatile or prolonged sideways market environments. It's recommended to establish market environment identification mechanisms, pausing or adjusting strategy parameters during unfavorable conditions.
Complexity management risk cannot be overlooked. While multi-indicator combinations improve accuracy, they also increase strategy complexity, potentially leading to execution difficulties or understanding deviations. Clear operational procedures and monitoring mechanisms must be established to ensure correct strategy execution.
Strategy Optimization Directions
Dynamic parameter adjustment mechanisms represent an important optimization direction. The current strategy uses fixed parameter settings; consideration could be given to introducing adaptive parameter adjustment functionality that dynamically adjusts EMA periods, RSI thresholds, and volume multipliers based on factors like market volatility and trend strength, improving strategy adaptability across different market environments.
Adding market environment identification modules would significantly enhance strategy effectiveness. By introducing volatility indicators, trend strength indicators, and market regime identification algorithms, current market environment characteristics can be automatically identified with corresponding signal generation logic adjustments. Stop-loss ranges would increase in high volatility environments while parameter settings would tighten during low volatility periods.
Enhanced candlestick pattern recognition systems deserve in-depth development. Beyond existing engulfing and pin bar patterns, additional classic patterns like doji, hammer, and shooting star could be included, along with pattern strength assessment mechanisms that assign different signal weights based on pattern perfection degrees.
Multi-timeframe analysis integration would substantially improve strategy comprehensiveness. By simultaneously analyzing technical indicator states across different time periods, overall market trends and short-term opportunities can be better captured. For example, requiring daily-level trends to align with hourly-level signals would improve trading success probabilities.
Machine learning-assisted optimization represents a cutting-edge development direction. Machine learning algorithms could analyze historical signal success rate patterns, identifying the most effective parameter combinations and market conditions, achieving intelligent strategy upgrades. Additionally, through deep learning technologies like neural networks, complex market patterns that traditional technical analysis cannot identify could be discovered.
Summary
The Multi-Technical Indicator Momentum Breakout Trading Strategy represents a mature methodology in the quantitative trading field, systematically integrating multiple technical analysis tools to construct a relatively complete trading decision framework. The strategy's core value lies in improving signal quality through multiple confirmation mechanisms while maintaining sufficient flexibility to adapt to different market environments and trading preferences.
While the strategy possesses numerous design advantages, its limitations must also be recognized, particularly the lag inherent in technical analysis and over-optimization risks. Successfully employing this strategy requires traders to possess solid technical analysis foundations, deep understanding of each indicator's characteristics and limitations, and the ability to flexibly adjust strategy parameters based on market changes.
Future optimization development should focus on enhancing intelligence and adaptability by introducing more advanced analytical techniques and machine learning methods, enabling the strategy to better adapt to complex and changing market environments. Simultaneously, continuous improvement of risk management mechanisms is a key factor in ensuring long-term stable strategy performance.
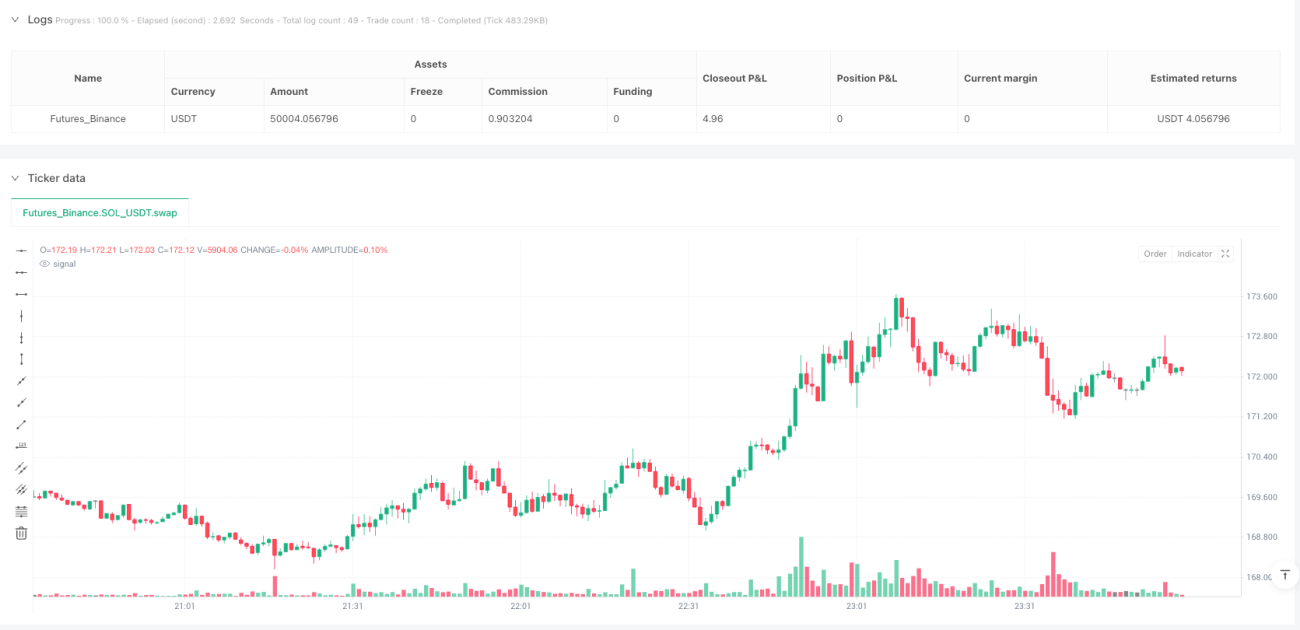
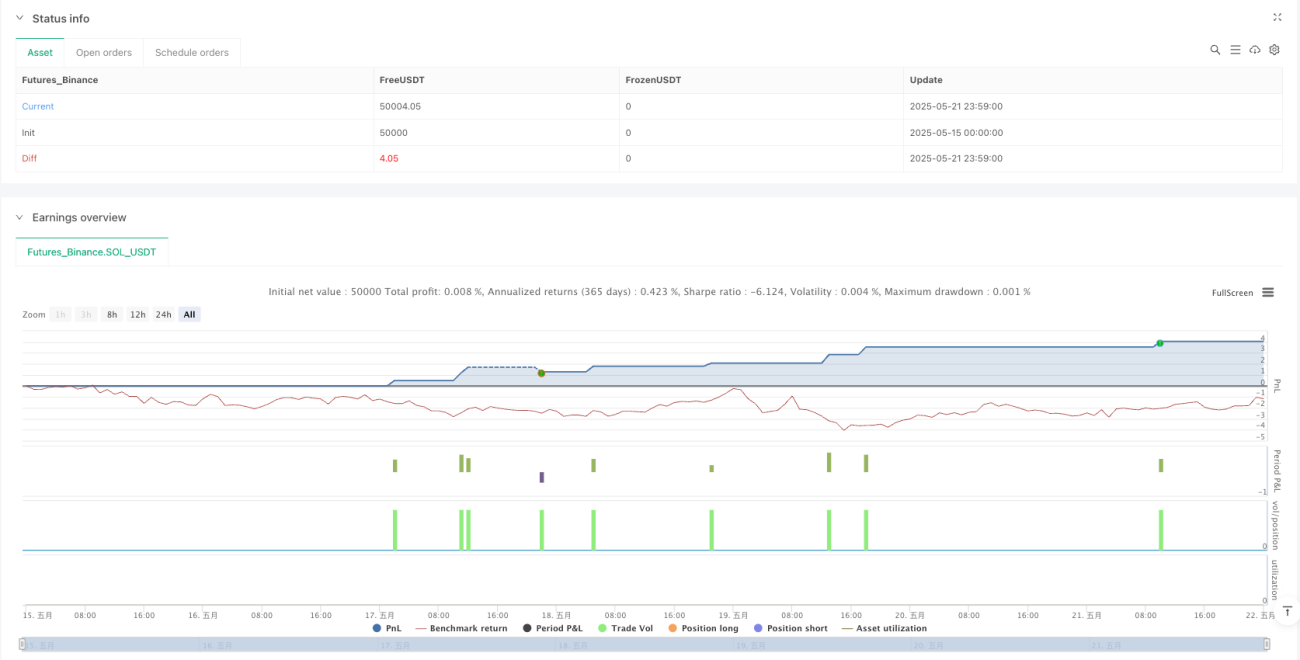
/*backtest
start: 2025-05-15 00:00:00
end: 2025-05-22 00:00:00
period: 1m
basePeriod: 1m
exchanges: [{"eid":"Futures_Binance","currency":"SOL_USDT"}]
*/

//@version=5
strategy("RSI + EMA + Volume + Candlestick Pattern Trading Bot", overlay=true)

// === Input: Enable/Disable signals and conditions ===- 1