
Overview
The Momentum Bollinger Breakout Volume Strategy with EMA Exit Mechanism is a quantitative trading strategy based on weekly charts that primarily utilizes Bollinger Band breakouts, RSI momentum indicators, and volume screening to determine entry points, while using a 9-period EMA as an exit signal. This strategy aims to capture strong upward trends that break through the upper Bollinger Band accompanied by high trading volume, ensuring quality trading signals through strict filtering conditions, while using EMA signals to exit the market in a timely manner to secure profits or control risks.
Strategy Principles
The core principle of this strategy is to combine multiple technical indicators to form a comprehensive trading system:
-
Bollinger Band Breakout: Using 20-period Bollinger Bands, the initial entry signal occurs when the price breaks above the upper band (indicating strong momentum).
-
RSI Momentum Confirmation: Requires RSI(14) to be greater than 50, ensuring the market is in an upward momentum phase.
-
Volume Screening:
- Price multiplied by volume (dollar volume) must be greater than 1 billion, ensuring sufficient liquidity
- Relative volume (current volume compared to 20-week average) greater than 2, ensuring significant volume expansion
-
9-period EMA Exit Mechanism: When the price falls below the 9-period EMA, an exit signal is triggered, closing all positions.
The strategy code implements the following logic: first calculating all necessary technical indicators, then setting entry conditions as price breaking above the upper Bollinger Band, RSI greater than 50, dollar volume greater than 1 billion, and relative volume greater than 2x. New buy signals are only executed when there are no open trades. The exit condition is price closing below the 9-period EMA while having open trades.
Strategy Advantages
-
Multiple Confirmation Mechanism: Combines price breakouts, momentum indicators, and volume indicators for multiple confirmations, effectively reducing false breakout signals.
-
High Liquidity Screening: By setting thresholds for dollar volume and relative volume, ensures trading instruments have sufficient liquidity, reducing slippage and execution risks.
-
Clear Exit Mechanism: Using the 9-period EMA as an exit signal provides a clear and objective stop-loss/take-profit point, avoiding hesitation and errors caused by subjective judgment.
-
Weekly Timeframe Operation: Strategies based on weekly charts typically filter out intraday and short-term noise, capturing medium to long-term trends, reducing trading frequency and related costs.
-
Simple to Execute: The strategy logic is clear, uses common technical indicators, and is easy to understand and execute, suitable for traders of different experience levels.
-
Holistic Capital Management: The strategy defaults to using 100% of account funds for trading, simplifying the capital management process, suitable for traders focusing on a single strategy.
Strategy Risks
-
Reversal Risk: After breaking through the upper Bollinger Band, the market may quickly reverse, especially in over-extended trends, potentially leading to significant drawdowns. The solution is to consider adding additional overbought indicators as filters.
-
Lagging Exits: The 9-period EMA is a lagging indicator and may not provide timely exit signals in rapidly falling markets, leading to larger drawdowns. Consider combining more sensitive short-term indicators or introducing trailing stop mechanisms.
-
Overtrading: In highly volatile markets, prices may frequently break through the upper Bollinger Band only to quickly retreat, leading to multiple false signals. This can be addressed by adding duration requirements (such as maintaining the breakout state for several consecutive days).
-
Capital Management Risk: Using 100% of funds for each trade may be too aggressive and not conducive to risk diversification. It's recommended to adjust position sizes according to personal risk tolerance.
-
Weekly Timeframe Delay: Using weekly charts means entry and exit signals can only be confirmed on weekends, potentially missing important intraday or daily market changes.
Strategy Optimization Directions
-
Dynamic Volatility Adjustment: The strategy currently uses a fixed 2x standard deviation to set Bollinger Band width. Consider dynamically adjusting this parameter based on market volatility, using smaller multipliers in low-volatility environments and larger multipliers in high-volatility environments.
-
Phased Position Building and Reduction: Implement mechanisms for phased entry and exit rather than using all funds at once, reducing timing risk and optimizing average cost.
-
Add Trend Confirmation Indicators: Consider adding long-term moving averages (such as 50-period or 200-period) as trend filters, only opening positions when the long-term trend is upward, improving win rates.
-
Stop-Loss Optimization: Introduce dynamic stops based on ATR (Average True Range) or set maximum drawdown percentage stops to enhance risk management capabilities.
-
Enhanced Volume Analysis: Add volume pattern recognition functions, such as OBV (On-Balance Volume) or Accumulation/Distribution Line, to further confirm whether volume supports price movements.
-
Seasonality and Market Environment Adaptation: Adjust strategy parameters for different market environments (bull markets, bear markets, ranging markets) or seasonal factors to improve strategy adaptability.
Summary
The Momentum Bollinger Breakout Volume Strategy with EMA Exit Mechanism is a well-designed comprehensive quantitative trading system that captures strong upward trends on a weekly timeframe by combining price breakouts, momentum confirmation, and volume screening. The strategy's strengths lie in its multiple confirmation mechanisms and clear exit strategy, while risks primarily come from potential lagging exits and capital management issues.
By implementing the suggested optimization measures, such as dynamic volatility adjustment, phased position building and reduction, enhanced trend confirmation, and stop-loss optimization, the strategy's stability and profitability can be further improved. This strategy is particularly suitable for assets exhibiting strong breakouts accompanied by large trading volumes, capturing medium to long-term trend opportunities while maintaining relatively low trading frequency.
Whether experienced quantitative traders or trading novices, anyone can benefit from this strategy as long as they correctly understand the principles and carefully manage risks. Most importantly, traders should conduct thorough backtesting before live trading and adjust parameters according to personal risk preferences and market conditions.
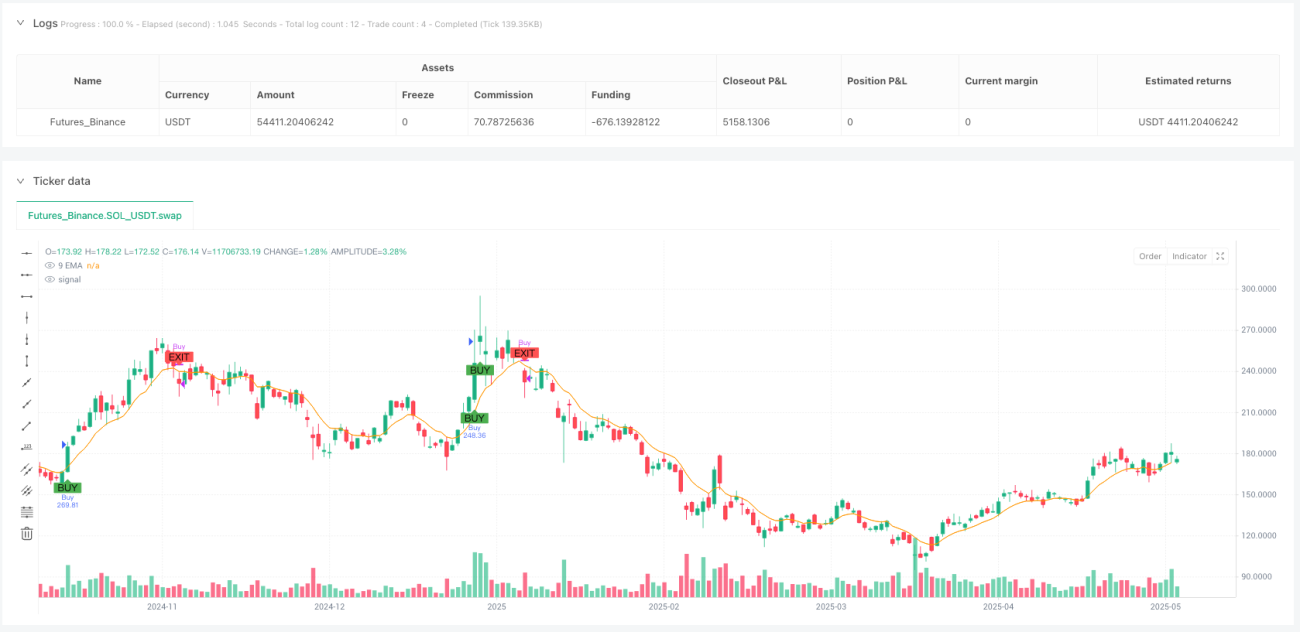
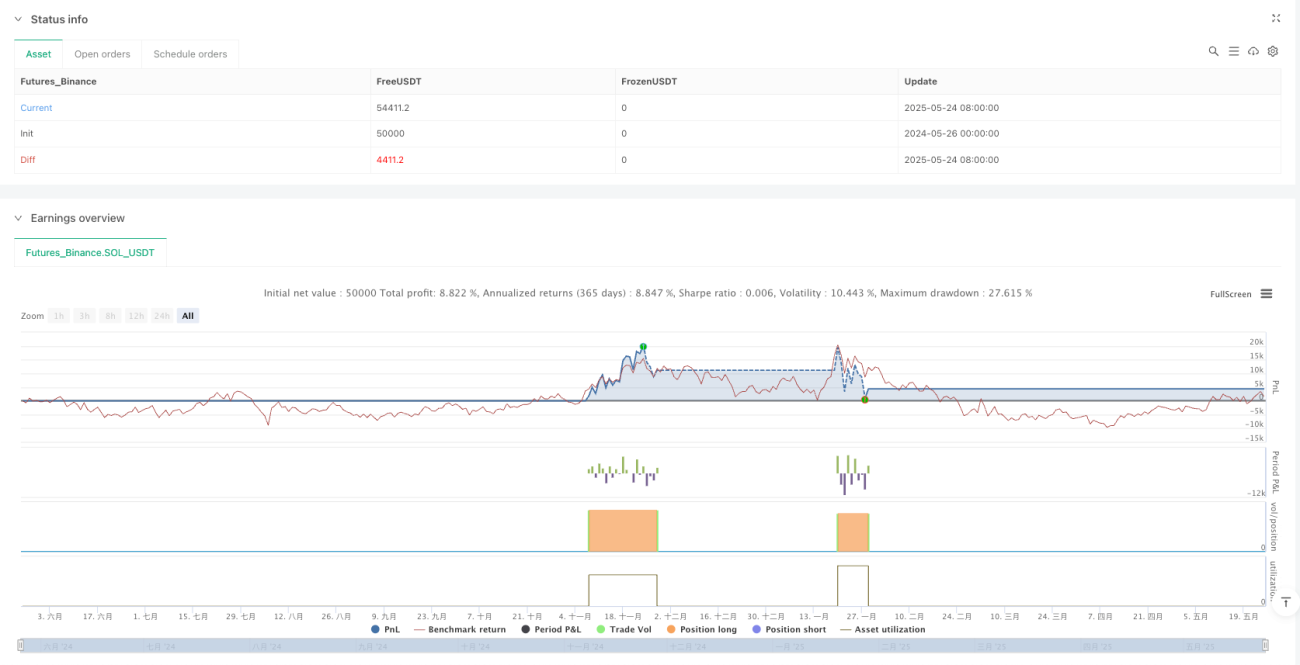
/*backtest
start: 2024-05-26 00:00:00
end: 2025-05-25 00:00:00
period: 1d
basePeriod: 1d
exchanges: [{"eid":"Futures_Binance","currency":"SOL_USDT"}]
*/

//@version=5
strategy("Growth Screener Strategy with 9 EMA Exit", overlay=true, default_qty_type=strategy.percent_of_equity, default_qty_value=100)

// Weekly timeframe variables- 1