Dynamic ATR-Adjusted Range Filter Trend Following Strategy

Overview
The Dynamic ATR-Adjusted Range Filter Trend Following Strategy is a quantitative trading system based on price volatility ranges. This strategy cleverly combines technical indicators such as Simple Moving Average (SMA), Standard Deviation (STDEV), and Average True Range (ATR) to identify market trends and trading signals by constructing upper and lower volatility bands. The core of the strategy lies in building dynamic price channels through the combination of moving averages and volatility, using ATR to dynamically adjust take-profit and stop-loss levels, while also providing flexible trailing stop options, allowing the strategy to maintain adaptability in different market environments. Through optimized parameter settings, the strategy can effectively capture trending market opportunities while maintaining robust risk management.
Strategy Principle
The operating mechanism of this strategy is based on the following key steps:
-
Range Filter Calculation: First, the strategy uses a Simple Moving Average (SMA) as the center line, then calculates upper and lower bands based on the standard deviation of price. Upper band = SMA + Multiplier × Standard Deviation; Lower band = SMA - Multiplier × Standard Deviation. This method dynamically adjusts the channel width according to market volatility.
-
Trend Identification: When the price breaks above the upper band, the strategy identifies an uptrend; when the price breaks below the lower band, the strategy identifies a downtrend. This trend judgment method helps filter out market noise.
-
Entry Conditions: A long signal is triggered when the price crosses above the upper band and was not previously in an uptrend; a short signal is triggered when the price crosses below the lower band and was not previously in a downtrend.
-
Exit Strategy: The strategy provides two exit methods:
- Fixed Take Profit/Stop Loss: Sets dynamic take profit and stop loss levels based on ATR, with the take profit distance being ATR × TP Multiplier and the stop loss distance being ATR × SL Multiplier.
- Trailing Stop: Uses an ATR-based trailing stop that adjusts as the price moves favorably.
-
Position Management: The strategy uses position management based on a percentage of account equity, defaulting to 100% of account equity for trading.
The core advantage of this strategy is its adaptability. By combining moving averages, standard deviation, and ATR indicators, the strategy parameters can automatically adjust according to market volatility, thus maintaining good performance in different market environments.
Strategy Advantages
Through in-depth analysis of the code, this strategy has the following significant advantages:
-
Strong Adaptability: The strategy uses standard deviation to dynamically adjust channel width, allowing it to automatically adapt in both high and low volatility markets, avoiding the failure of fixed parameter strategies in different market environments.
-
Comprehensive Risk Management: The strategy integrates an ATR-based dynamic take profit and stop loss mechanism, making risk control more precise and reasonable. Stop loss and take profit levels automatically adjust with changes in market volatility.
-
High-Quality Trading Signals: Through trend confirmation mechanisms, the strategy can effectively filter false breakout signals, improving trade success rates. Trading signals are only triggered when breaking above/below bands and not previously in the corresponding trend.
-
Flexible Exit Strategies: Provides choices between fixed take profit/stop loss and trailing stops, allowing traders to choose suitable exit methods based on their risk preferences and market judgments. Trailing stops are particularly suitable for capturing major trends.
-
Visualization Aids Decision-Making: The strategy provides clear visualization of upper and lower bands, moving averages, and take profit/stop loss levels, helping traders intuitively understand market conditions and strategy performance.
-
Large Parameter Optimization Space: The strategy provides multiple adjustable parameters, including range filter length, multiplier, ATR length, take profit/stop loss multipliers, etc., allowing traders to perform targeted optimization for different markets and trading instruments.
Strategy Risks
Despite its reasonable design, the strategy still has the following potential risks:
-
Parameter Sensitivity: Strategy performance is sensitive to parameter settings, especially the length and multiplier of the range filter. Inappropriate parameters may lead to overtrading or missing important market movements. The solution is to find robust parameter combinations through backtesting in different market environments.
-
Trend Reversal Risk: In market environments where strong trends suddenly reverse, the strategy may not react quickly enough, leading to significant drawdowns. To mitigate this risk, consider combining other trend reversal indicators for signal confirmation.
-
Poor Performance in Low Volatility Markets: In long-term consolidation or low volatility markets, the strategy may generate many false signals. It is recommended to appropriately increase the filter multiplier or add additional trading filter conditions in such market environments.
-
Stop Loss Slippage Risk: During periods of insufficient market liquidity or high volatility, the actual stop loss execution price may differ from expectations. This can be addressed by setting more conservative stop loss levels or adjusting stop loss distances considering market volatility factors.
-
Over-Optimization Risk: Since the strategy provides multiple optimizable parameters, there is a risk of overfitting historical data. The solution is to use out-of-sample testing and forward testing to verify the robustness of the strategy.
Strategy Optimization Directions
Based on code analysis, the strategy can be optimized in the following directions:
-
Add Market Environment Filtering: Additional market environment judgment mechanisms can be introduced, such as volatility indicators (like VIX or relative ATR values) to determine which parameter combination is suitable for the current market. Dynamic parameter adjustment in different market environments can even be considered. This is because optimal parameters often differ significantly in different market environments.
-
Enhance Trend Confirmation Mechanism: Other trend indicators (such as ADX, MACD, etc.) can be combined as auxiliary confirmation to improve trend judgment accuracy. This can effectively reduce false signals in oscillating markets.
-
Optimize Fund Management: The strategy currently uses a fixed percentage of account equity for trading. Consider volatility-based or risk-adjusted position management, such as the Kelly formula or fixed fraction method, to achieve an optimal capital growth curve.
-
Add Time Filtering: Trading time filter conditions can be added to avoid periods of high market volatility or insufficient liquidity, such as economic data release times or market opening/closing periods.
-
Multi-Timeframe Analysis: Introduce multi-timeframe confirmation mechanisms, for example, requiring the trend direction of larger timeframes to be consistent with the trading direction, to improve trade success rates. This method can effectively filter out low-win-rate signals against major trends.
-
Optimize Exit Mechanisms: Consider dynamically adjusting take profit and stop loss ratios based on market volatility states, or adding partial profit-taking mechanisms (such as segmented profit-taking), to avoid missing major market movements while maintaining high win rates.
Summary
The Dynamic ATR-Adjusted Range Filter Trend Following Strategy is a well-structured, logically clear quantitative trading system that identifies trends through dynamic channels constructed from moving averages and standard deviations, combined with ATR for precise risk management. The strategy's greatest features are its adaptability and comprehensive risk control mechanisms, allowing it to maintain stable performance in different market environments.
Through reasonable parameter settings and possible optimization measures, this strategy has the potential to achieve stable returns in trending markets. However, when using this strategy, traders should pay attention to the robustness of parameter optimization, avoid overfitting, and make targeted adjustments based on the characteristics of the actual trading instruments. At the same time, incorporating the optimization directions proposed in this article, such as market environment filtering and multi-timeframe analysis, can further enhance the strategy's robustness and profitability.
Overall, this is a reasonably designed, fully functional quantitative strategy framework, suitable for traders with certain quantitative trading experience to apply and further optimize in live trading.
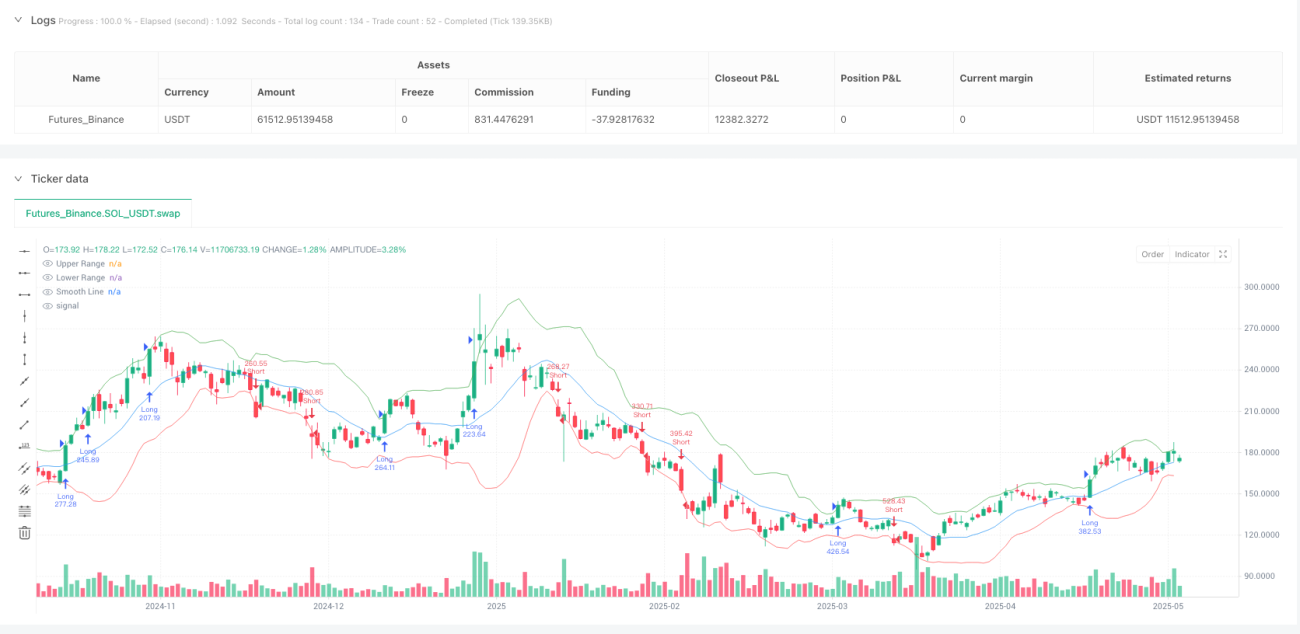
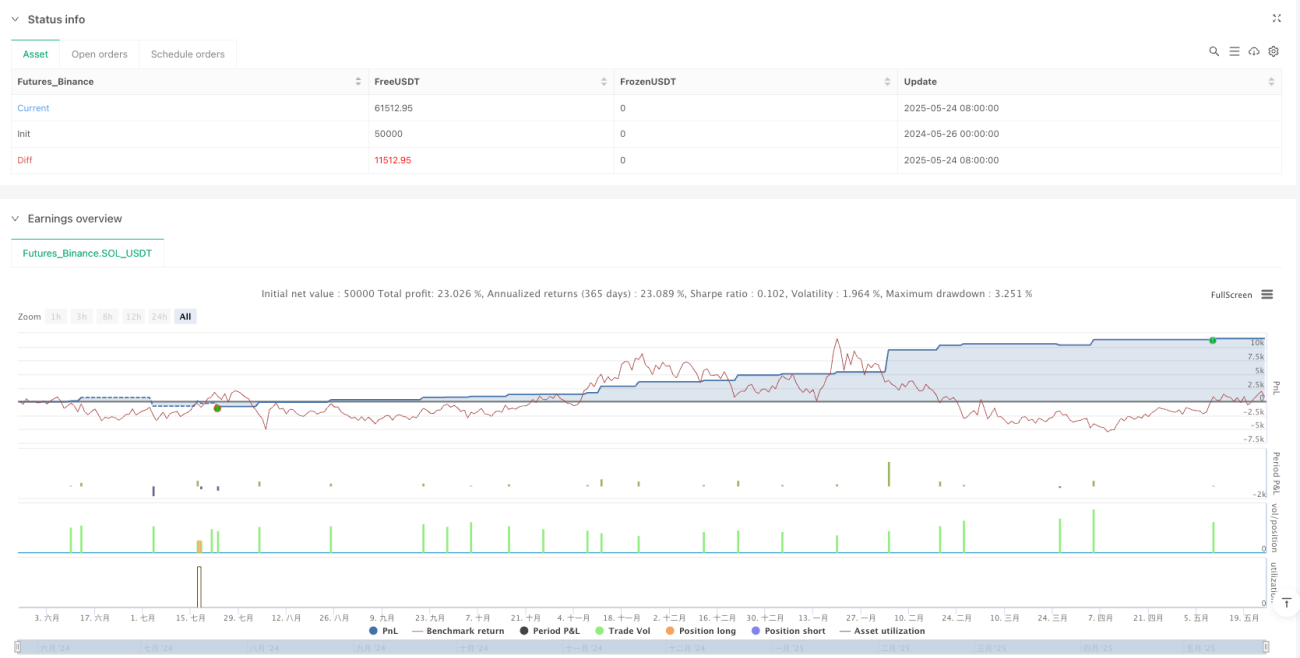
/*backtest
start: 2024-05-26 00:00:00
end: 2025-05-25 00:00:00
period: 1d
basePeriod: 1d
exchanges: [{"eid":"Futures_Binance","currency":"SOL_USDT"}]
*/

//@version=5
strategy("Optimized Range Filter Strategy", overlay=true, default_qty_type=strategy.percent_of_equity, default_qty_value=100, pyramiding=0)

// Optimization Inputs- 1