Multi-Indicator Momentum-Trend Confluence Trading System

Overview
The Multi-Indicator Momentum-Trend Confluence Trading System is a comprehensive intraday trading strategy that identifies potential trading opportunities by integrating multiple technical indicators. This strategy combines trend analysis, momentum indicators, volume confirmation, and candlestick pattern recognition to form a comprehensive trading decision framework. Its core concept is to execute trades when multiple technical indicators simultaneously provide consistent signals, thereby increasing trade success rates and reliability. The strategy is primarily designed for 15-minute timeframe intraday trading, employing strict entry and exit conditions to control risk, while using labels and shapes to clearly illustrate the trading logic.
Strategy Principles
The Multi-Indicator Momentum-Trend Confluence Trading System operates based on the synchronized confirmation of four core technical analysis dimensions:
-
Trend Analysis: Uses the crossover relationship between the fast EMA(20) and slow EMA(50) to determine market trend direction. When the fast EMA is above the slow EMA, it indicates an uptrend; conversely, it indicates a downtrend.
-
Momentum Indicators: Evaluates price momentum through RSI(14) and MACD(12,26,9). RSI greater than 50 and MACD line above the signal line indicate strong upward momentum; the opposite indicates downward momentum.
-
Volume Confirmation: The strategy sets a minimum volume threshold (100,000) to ensure trades are only executed when market liquidity is sufficient, avoiding slippage and execution issues in low liquidity environments.
-
Pattern Recognition: Utilizes Engulfing Patterns to capture potential reversal signals. Bullish engulfing patterns are combined with long entry conditions, while bearish engulfing patterns are combined with short entry conditions.
Entry Logic:
- Long Entry: The system generates a buy signal when the fast EMA > slow EMA, RSI > 50, MACD line > MACD signal line, volume meets the minimum requirement, and a bullish engulfing pattern appears.
- Short Entry: The system generates a sell signal when the fast EMA < slow EMA, RSI < 50, MACD line < MACD signal line, volume meets the minimum requirement, and a bearish engulfing pattern appears.
Exit Logic:
- Long Exit: The system closes long positions when RSI falls below 50 or the MACD line crosses below the MACD signal line.
- Short Exit: The system closes short positions when RSI rises above 50 or the MACD line crosses above the MACD signal line.
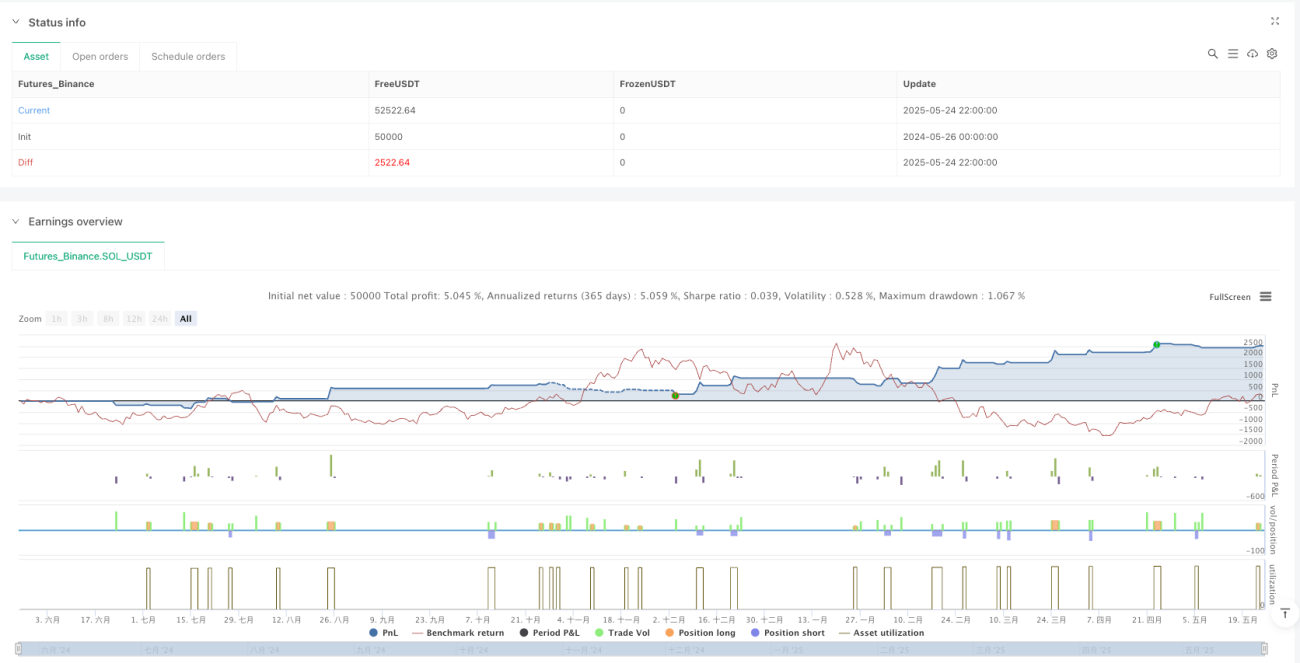
The strategy's position management adopts a percentage of account equity model, using 10% of account equity for each trade to balance risk and reward.
Strategy Advantages
-
Multi-dimensional Confirmation: The strategy combines signal confirmation from four dimensions: trend, momentum, volume, and pattern, greatly reducing the possibility of false signals and improving trade success rates.
-
Strong Adaptability: Through adjustable parameter settings (such as EMA length, RSI period, MACD parameters, etc.), the strategy can adapt to different market environments and characteristics of various trading instruments.
-
Clear Entry and Exit Conditions: The strategy has clearly defined entry and exit rules, reducing subjective judgment and making the trading decision process more systematic and disciplined.
-
Visualization of Trading Signals: The strategy uses labels and shape markers to visually display trading signals, allowing traders to quickly understand market conditions and strategy logic.
-
Integrated Risk Management: Through exit mechanisms based on RSI and MACD reversals, the strategy can promptly identify changes in market momentum and control potential losses.
-
Liquidity Assurance: The minimum volume filter ensures trades are only executed when market liquidity is sufficient, reducing execution risk.
-
Complementary Technical Indicators: The technical indicators used in the strategy are complementary, with EMA providing trend information, RSI and MACD providing momentum information, and volume and candlestick patterns providing additional confirmation signals.
Strategy Risks
-
Over-optimization Risk: The strategy includes multiple adjustable parameters, and excessive optimization may lead to backtest results that look good but perform poorly in actual trading. The solution is to use robust parameter settings and avoid overfitting historical data.
-
Signal Lag: Indicators such as EMA, RSI, and MACD are inherently lagging indicators, which may lead to less than ideal entry or exit timing. Consider adding some leading indicators to balance this risk.
-
Market Condition Dependency: The strategy performs better in markets with clear trends but may generate frequent false signals in oscillating markets. Adding a trend strength filter can help avoid trading in weak trend or oscillating markets.
-
Scarcity of Simultaneous Condition Fulfillment: Requiring multiple conditions to be met simultaneously may result in fewer trading signals, affecting the strategy's return potential. Consider appropriately relaxing certain conditions or introducing a weighting system.
-
Indicator Redundancy Risk: RSI and MACD are both momentum indicators and may have some degree of information redundancy. Consider replacing one with an indicator from a different category to obtain market information from more dimensions.
-
Adaptability Issues with Fixed Parameters: When market conditions change, fixed parameter settings may no longer be applicable. Consider implementing an adaptive parameter adjustment mechanism that dynamically adjusts parameters based on market volatility.
-
Capital Management Risk: Using a fixed proportion of account equity may carry excessive risk in some situations. It is recommended to implement more dynamic position sizing control in combination with ATR.
Strategy Optimization Directions
-
Dynamic Parameter Adjustment: Parameters for EMA, RSI, and MACD can be dynamically adjusted based on market volatility, using shorter periods in high-volatility markets and longer periods in low-volatility markets to adapt to different market environments.
-
Enhanced Exit Mechanism: The current strategy's exit is based on RSI and MACD reversals. Consider adding take-profit and stop-loss mechanisms, such as ATR-based trailing stops, to better protect profits and control risk.
-
Time Filters: Add time filtering functionality to avoid trading during high-volatility periods around market open and close, or to focus on specific high-efficiency trading sessions.
-
Volume-Price Relationship Analysis: Beyond simple minimum volume filtering, more complex volume-price relationship analysis can be added, such as relative volume indicators or money flow indicators, to gain more accurate liquidity insights.
-
Multiple Timeframe Analysis: Introduce a multiple timeframe analysis framework to ensure intraday trading signals align with trends on higher timeframes, avoiding trading against major trends.
-
Machine Learning Enhancement: Use machine learning algorithms to optimize parameter selection or assign probability weights to trading signals, improving the strategy's adaptability and accuracy.
-
Market Regime Identification: Add market state recognition functionality to use different trading logic in trending and oscillating markets, enhancing the strategy's overall robustness.
-
Correlation Analysis: Introduce correlation analysis with other assets as an additional trading filter condition to avoid excessive exposure to the same risk when markets are highly correlated.
Conclusion
The Multi-Indicator Momentum-Trend Confluence Trading System is a comprehensive and systematic intraday trading strategy that provides a multi-dimensional trading decision framework by integrating trend analysis, momentum indicators, volume confirmation, and candlestick pattern recognition. The core advantage of this strategy lies in its strict multiple confirmation mechanism, which effectively reduces the risk of false signals and improves trading quality.
Although the strategy features clear entry and exit conditions, visualized trading signals, and integrated risk management functions, it still faces challenges such as over-optimization, indicator lag, and market condition dependency. Through optimization measures such as dynamic parameter adjustment, enhanced exit mechanisms, time filters, and multiple timeframe analysis, the strategy's robustness and adaptability can be further improved.
For intraday traders, this strategy provides a structured trading approach, but it's important to continuously monitor and evaluate strategy performance and make necessary adjustments based on changing market environments. Ultimately, trading success depends not only on strategy design but also on disciplined execution and continuous improvement.
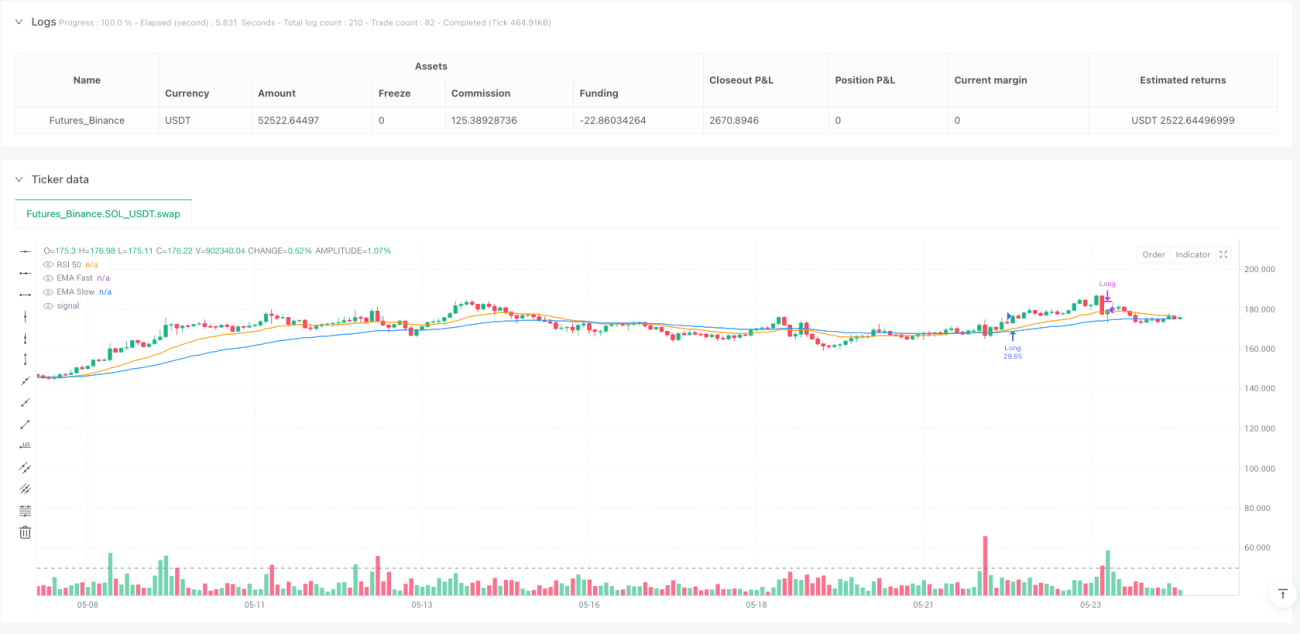
/*backtest
start: 2024-05-26 00:00:00
end: 2025-05-25 00:00:00
period: 2h
basePeriod: 2h
exchanges: [{"eid":"Futures_Binance","currency":"SOL_USDT"}]
*/

//@version=5
strategy("Intraday Multi-Indicator Strategy", overlay=true, default_qty_type=strategy.percent_of_equity, default_qty_value=10)

// === Inputs ===- 1