Dynamic Fibonacci Retracement Trend-Following Quantitative Strategy

Overview
The Dynamic Fibonacci Retracement Trend-Following Quantitative Strategy is a technical analysis trading system based on Fibonacci retracement levels, specifically designed to identify potential buy and sell signals in trending markets. This strategy calculates Fibonacci retracement levels (23.6%, 38.2%, 50%, and 61.8%) between price highs and lows, treating these levels as potential support and resistance zones, generating trading signals when price interacts with these key levels. The core advantage of this strategy lies in its flexibility, allowing traders to select trend direction ("From Top to Bottom" or "From Bottom to Top") based on market conditions, and customize entry levels, take profit, and stop loss parameters to adapt to different market environments and risk preferences.
Strategy Principles
The working principle of this strategy revolves around the application of the Fibonacci sequence, a mathematical relationship widely used in financial markets. The specific implementation steps are as follows:
-
Historical Analysis: The strategy first identifies the highest and lowest prices within a user-defined lookback period (default 144 periods) as the basis for calculating Fibonacci retracement levels.
-
Direction Selection: Depending on the user-selected Fibonacci direction ("From Top to Bottom" or "From Bottom to Top"), the strategy employs different calculation methods. If "From Top to Bottom" is selected, the highest point is set as the 0% level and the lowest point as the 100% level; if "From Bottom to Top" is selected, the opposite applies.
-
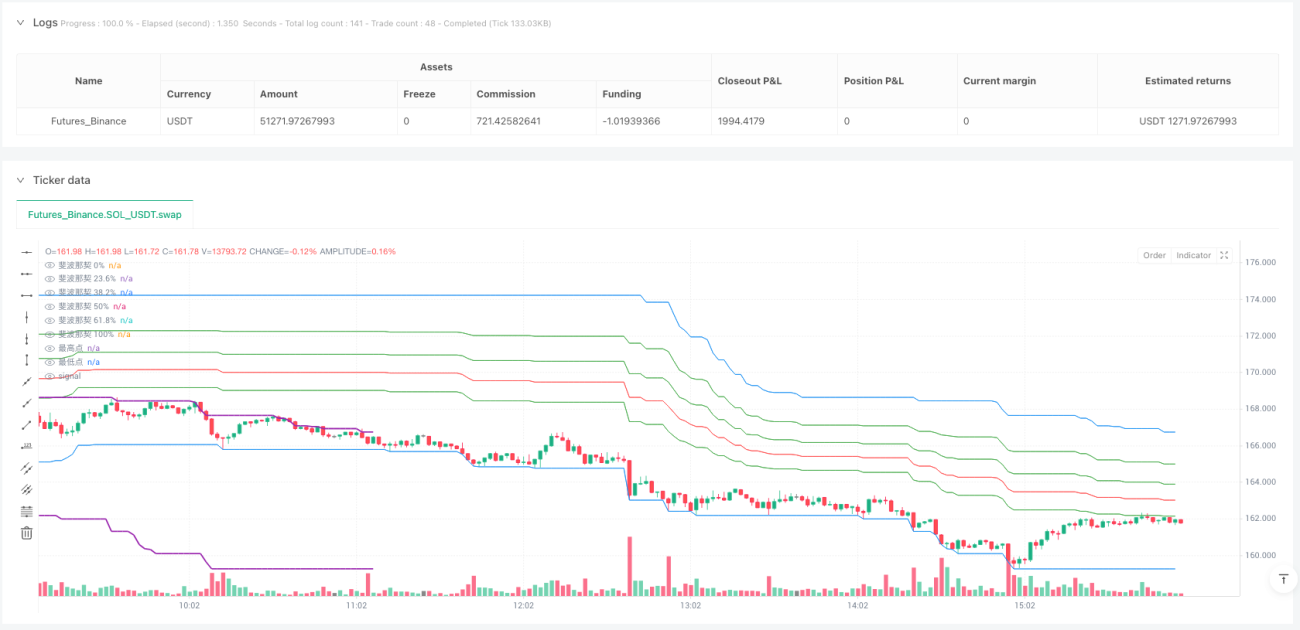
Level Calculation: Based on identified highs and lows and the selected direction, the strategy calculates four key Fibonacci retracement levels: 23.6%, 38.2%, 50%, and 61.8%.
-
Signal Generation:
- Buy Signal: Triggered when the price crosses above the user-selected Fibonacci level (default 61.8%) and the closing price is above this level.
- Sell Signal: Triggered when the price crosses below the user-selected Fibonacci level (default 38.2%) and the closing price is below this level.
-
Risk Management: The strategy automatically sets take profit and stop loss when trade signals are triggered, with default values of 24 pips for take profit and 4 pips for stop loss, converted to price units using syminfo.mintick multiplied by 10.
-
Visualization: The strategy plots all Fibonacci levels, highest and lowest points, and buy/sell signals on the chart, providing intuitive visual analysis assistance.
Strategy Advantages
-
High Adaptability: The strategy allows users to select the Fibonacci direction based on current market trends, making it effective in both uptrends and downtrends, enhancing the flexibility and adaptability of the strategy.
-
Customizable Parameters: Users can customize entry levels, lookback periods, take profit, and stop loss parameters according to personal trading style and risk preference, increasing the personalization of the strategy.
-
Solid Technical Foundation: The strategy is based on the widely recognized Fibonacci retracement theory, which has a solid theoretical foundation and practical verification in the field of technical analysis, enhancing the reliability of the strategy.
-
Clear Visual Assistance: By intuitively displaying Fibonacci levels, high/low points, and trading signals on the chart, traders can more easily understand market structure and strategy logic, aiding the decision-making process.
-
Integrated Risk Management: The strategy has built-in stop loss and take profit mechanisms, automatically setting risk parameters for each trade, helping to maintain consistent risk management rules and protect capital safety.
-
Real-time Dynamic Calculation: The strategy continuously updates Fibonacci levels, ensuring calculations are always based on recent highs and lows, keeping the analysis relevant to current market conditions.
Strategy Risks
-
Lookback Period Sensitivity: The strategy relies on the lookback period to determine highs and lows, and different lookback periods may lead to significantly different results. Too short a period may result in too many noise signals, while too long a period may miss important market turning points. Solution: It is recommended to backtest different lookback periods to find the optimal settings for specific markets and timeframes.
-
False Signals in Oscillating Markets: In sideways or oscillating markets, prices may frequently cross Fibonacci levels, generating excessive trading signals, increasing trading costs, and potentially leading to consecutive losses. Solution: Consider adding additional filtering conditions, such as trend confirmation indicators (like moving averages or ADX) to reduce false signals.
-
Limitations of Fixed Pip Stop Loss and Take Profit: The strategy uses fixed pips for stop loss and take profit, which may not be suitable for all market conditions, especially when volatility changes. Solution: Consider using dynamic stop loss and take profit based on ATR (Average True Range) to adapt to current market volatility.
-
Single Indicator Dependency: Relying solely on Fibonacci retracements for trading decisions ignores other important market factors and indicators, potentially leading to insufficient signal quality. Solution: Combine the strategy with other technical indicators or price action analysis to build a multiple confirmation system.
-
Delayed Recognition of Trend Changes: The strategy may react slowly to trend changes because it calculates levels based on past highs and lows. Solution: Reduce the lookback period or add trend change early warning mechanisms, such as momentum indicators.
Strategy Optimization Directions
-
Integrate Multiple Timeframe Analysis: The current strategy runs on a single timeframe only. Consider integrating multiple timeframe analysis, such as confirming trend direction on a larger timeframe and then executing entry signals on a smaller timeframe to improve the robustness of the strategy. Rationale: This can reduce false signals and ensure trading direction aligns with the larger trend.
-
Introduce Dynamic Risk Management: Replace fixed pip stop loss and take profit with dynamic parameters based on ATR, allowing risk management to self-adapt to market volatility. Rationale: ATR can measure market volatility, automatically widening stop loss ranges during high volatility and narrowing them during low volatility, better matching market reality.
-
Add Volume Confirmation: Incorporate volume analysis when generating signals to ensure price breakouts are supported by sufficient trading volume. Rationale: Breakouts supported by volume are more reliable, reducing losses from false breakouts.
-
Implement Adaptive Fibonacci Calculation: Instead of basing calculations solely on a fixed lookback period, automatically adjust the lookback period according to market volatility, using longer periods during high volatility and shorter periods during low volatility. Rationale: This adaptive approach can better capture genuine market turning points.
-
Add Market State Classifier: Incorporate functionality that can identify the current market state (trending, ranging, or transitioning) and adopt different trading rules for different market states. Rationale: Different market states are suitable for different trading strategies; trending markets are suitable for trend following, while ranging markets are suitable for range trading.
-
Optimize Entry Timing: Building on the current foundation, add candlestick patterns or price action analysis to seek more precise entry timing near Fibonacci levels. Rationale: This can improve entry precision and enhance risk-reward ratios.
Summary
The Dynamic Fibonacci Retracement Trend-Following Quantitative Strategy is a systematic trading method based on classic technical analysis theory, providing traders with objective entry signals and a risk management framework by identifying the support and resistance effects of Fibonacci retracement levels. The main advantages of this strategy lie in its adaptability and customizability, allowing traders to adjust parameter settings for different market environments. However, it also faces challenges such as potential false signals in oscillating markets and dependency on a single indicator. There is significant room for optimization through integrating multiple timeframe analysis, introducing dynamic risk management, and adding additional confirmation indicators. For traders, understanding Fibonacci principles and their market applications is key to effectively using this strategy; combined with appropriate risk management and market analysis, this strategy can be a powerful weapon in the trading toolbox.
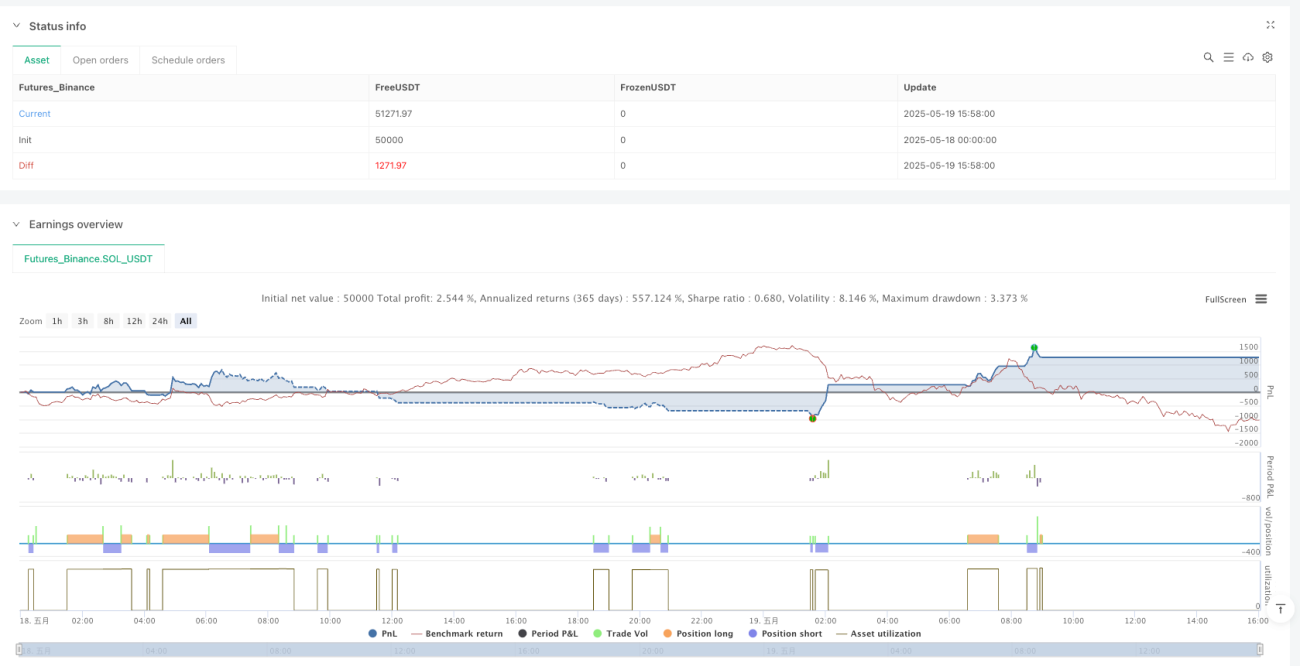
/*backtest
start: 2025-05-18 00:00:00
end: 2025-05-19 16:00:00
period: 2m
basePeriod: 2m
exchanges: [{"eid":"Futures_Binance","currency":"SOL_USDT"}]
*/

//@version=5
strategy("简单斐波那契回撤策略", overlay=true, initial_capital=1000,default_qty_type=strategy.percent_of_equity, default_qty_value=100)

// 输入回看周期以识别高点和低点- 1