
Overview
The Dynamic Range Filtering with ATR Risk Management Quantitative Strategy is a trading system that combines technical analysis with risk control mechanisms. This strategy identifies potential trend reversal points based on price position relative to its volatility range and uses Average True Range (ATR) to set dynamic take-profit and stop-loss levels, effectively managing risk for each trade. This approach not only captures price breakout opportunities but also automatically adjusts risk parameters according to current market volatility, allowing the strategy to maintain good adaptability in various market environments.
Strategy Principles
The core logic of this strategy revolves around two main components: the range filter and the ATR risk management system.
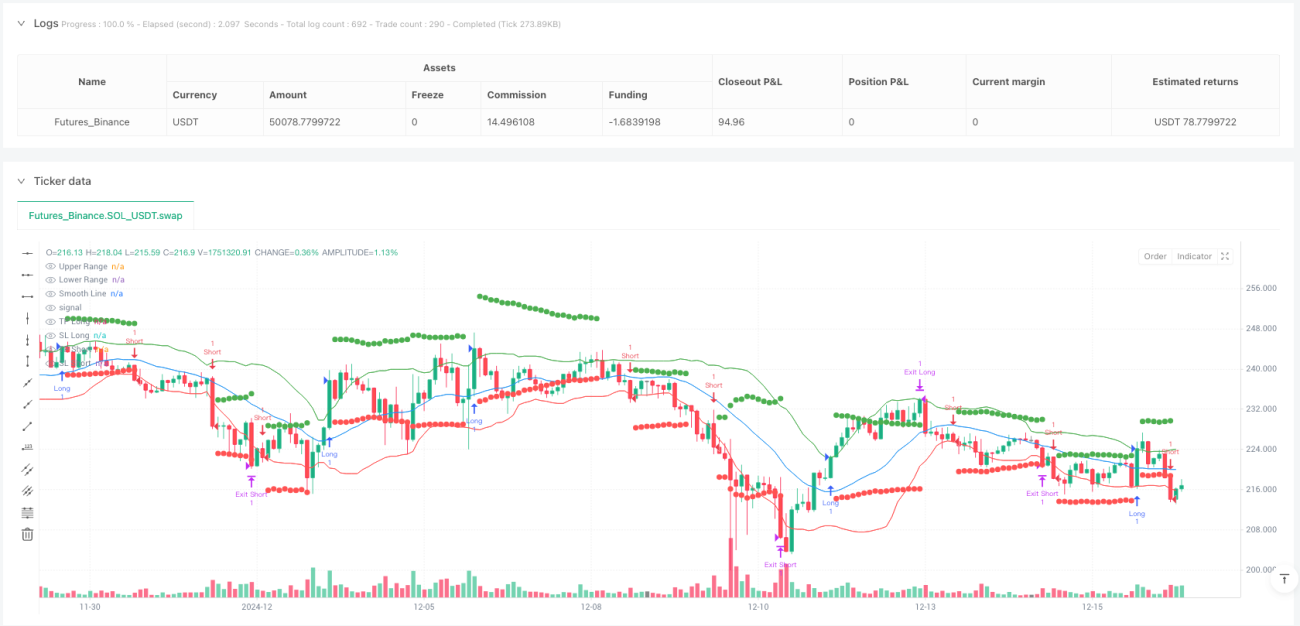
The range filter component first calculates a Simple Moving Average (SMA) of price as a center line. Then, it creates upper and lower channel bands based on the standard deviation of price multiplied by a factor. When the price breaks above the upper channel, the system identifies this as the potential start of an uptrend, triggering a long signal; when the price falls below the lower channel, the system identifies this as the potential start of a downtrend, triggering a short signal. The basic assumption of this approach is that significant price deviation from its average may indicate the formation of a new trend.
The key calculations in the code are as follows:
smooth = ta.sma(src, length)
dev = mult * ta.stdev(src, length)
upper = smooth + dev
lower = smooth - dev
The risk management component uses the ATR indicator to set dynamic Take Profit and Stop Loss levels. ATR is an important indicator for measuring market volatility; the higher its value, the more volatile the market. The strategy determines the distance for take-profit and stop-loss by multiplying ATR by specific factors, ensuring that in highly volatile markets, TP/SL points are automatically set further away, while in less volatile markets, TP/SL points are closer to the entry price.
The code implementation is as follows:
            takeProfitLong = strategy.position_avg_price + (atr * tpMultiplier)
stopLossLong = strategy.position_avg_price - (atr * slMultiplier)
takeProfitShort = strategy.position_avg_price - (atr * tpMultiplier)
stopLossShort = strategy.position_avg_price + (atr * slMultiplier)
Entry conditions are determined by checking whether the price breaks through the upper and lower channels of the range filter:
            longCondition = ta.crossover(close, upper) and not uptrend[1]
shortCondition = ta.crossunder(close, lower) and not downtrend[1]
It's worth noting that the strategy adds additional conditions not uptrend[1] and not downtrend[1] to avoid re-entering in an already confirmed trend, which helps reduce false signals.
Strategy Advantages
-
Strong Adaptability: By dynamically adjusting take-profit and stop-loss levels through ATR, the strategy can automatically adapt to the volatility characteristics of different markets, providing wider TP/SL space in high-volatility markets and tightening risk control in low-volatility markets.
-
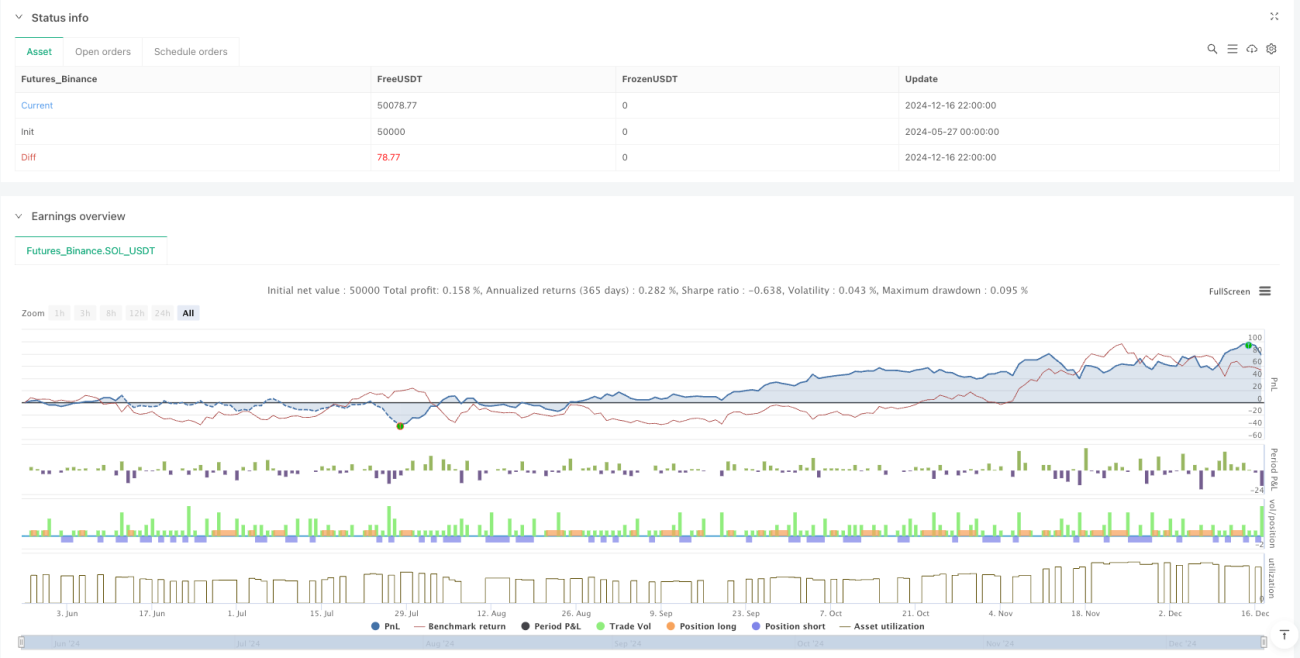
Comprehensive Risk Management: Each trade has clear take-profit and stop-loss levels, which not only limits the maximum loss per trade but also ensures that profits are locked in when they reach the expected target.
-
Optimizable Parameters: The strategy provides multiple adjustable parameters, including range filter length, multiplier, ATR calculation length, and TP/SL multipliers, allowing traders to optimize according to different markets and personal risk preferences.
-
Integration of Technical Indicators: The strategy combines multiple technical indicators such as moving averages, standard deviation, and ATR to form a comprehensive trading system that not only focuses on price breakouts but also considers market volatility.
-
Good Visualization: The strategy plots upper and lower channels, center lines, and current position TP/SL levels on the chart, allowing traders to visually monitor the strategy's execution.
Strategy Risks
-
False Breakouts in Ranging Markets: In ranging markets without clear trends, prices may frequently break through upper and lower channels, leading to multiple false signals and unnecessary trading costs. Possible solutions include adding confirmation indicators or extending filter length to reduce sensitivity.
-
Parameter Sensitivity: The strategy's performance is highly dependent on parameter settings, and different market environments may require different parameter combinations. Incorrect parameter settings may lead to poor strategy performance. It is recommended to use backtesting to find the parameters most suitable for specific markets.
-
Excessive Stop Loss Risk: In extremely volatile markets, ATR-based stop losses may be set too far, resulting in single-trade losses exceeding expectations. Consider setting an absolute maximum stop loss value to limit this risk.
-
Delayed Trend Reversal Recognition: While this strategy performs well in identifying the start of trends, it may lag in responding to trend reversals, leading to profit giveback. Consider adding trend reversal indicators to improve this aspect.
-
Lack of Volume Confirmation: The current strategy is based solely on price data without considering volume changes. In some markets, price breakouts without sufficient volume support may be false signals. Consider using volume as an additional confirmation factor.
Strategy Optimization Directions
-
Add Volume Filter: Consider using volume as an additional confirmation indicator, for example, requiring significant volume increase during price breakouts. This helps filter out low-quality breakout signals. A specific implementation could be calculating a moving average of volume and requiring the volume at breakout to be higher than a certain percentage of the average.
-
Introduce Trend Confirmation Indicators: For example, add long-period moving average direction judgment, only entering when the breakout direction aligns with the long-term trend. This helps avoid counter-trend trading.
-
Optimize Take-Profit/Stop-Loss Strategy: Consider implementing a trailing stop, which gradually raises the stop-loss position as the price moves favorably, locking in partial profits while giving the price sufficient room to move.
-
Time Filter: Some markets show significant differences in volatility and trend characteristics during specific time periods. Adding a time filter allows trading only during periods most suitable for the strategy.
-
Multi-Timeframe Analysis: Consider applying range filters across multiple timeframes, executing trades only when signals from multiple timeframes align. This helps reduce false signals.
-
Parameter Self-Adaptation Mechanism: Develop a mechanism that allows the strategy to automatically adjust parameters based on recent market performance, for example, increasing multipliers when volatility increases and decreasing them when volatility decreases.
-
Add Market Environment Filtering: Indicators such as ADX (Average Directional Index) can be used to determine whether the market is in a trending or ranging environment, and adjust strategy execution accordingly. For example, trading might be completely avoided in ranging markets.
Summary
The Dynamic Range Filtering with ATR Risk Management Quantitative Strategy is a comprehensive trading system that combines price breakout identification with dynamic risk management. By using range filters to identify potential trend reversal points and leveraging ATR to set take-profit and stop-loss levels that adapt to market volatility, this strategy can capture market breakout opportunities while maintaining good risk control.
The main advantages of this strategy lie in its adaptability and comprehensive risk management mechanisms, but it also faces challenges such as false breakouts in ranging markets and parameter sensitivity. There is significant room for optimization through adding volume confirmation, trend filtering, improving take-profit/stop-loss mechanisms, and other methods.
For traders, understanding the logical principles of this strategy and adjusting parameters according to their specific markets and risk preferences is key to successfully applying it. Additionally, continuously monitoring and evaluating strategy performance, making necessary adjustments and optimizations in a timely manner, are important measures to maintain the long-term effectiveness of the strategy.
- 1