
Strategy Overview
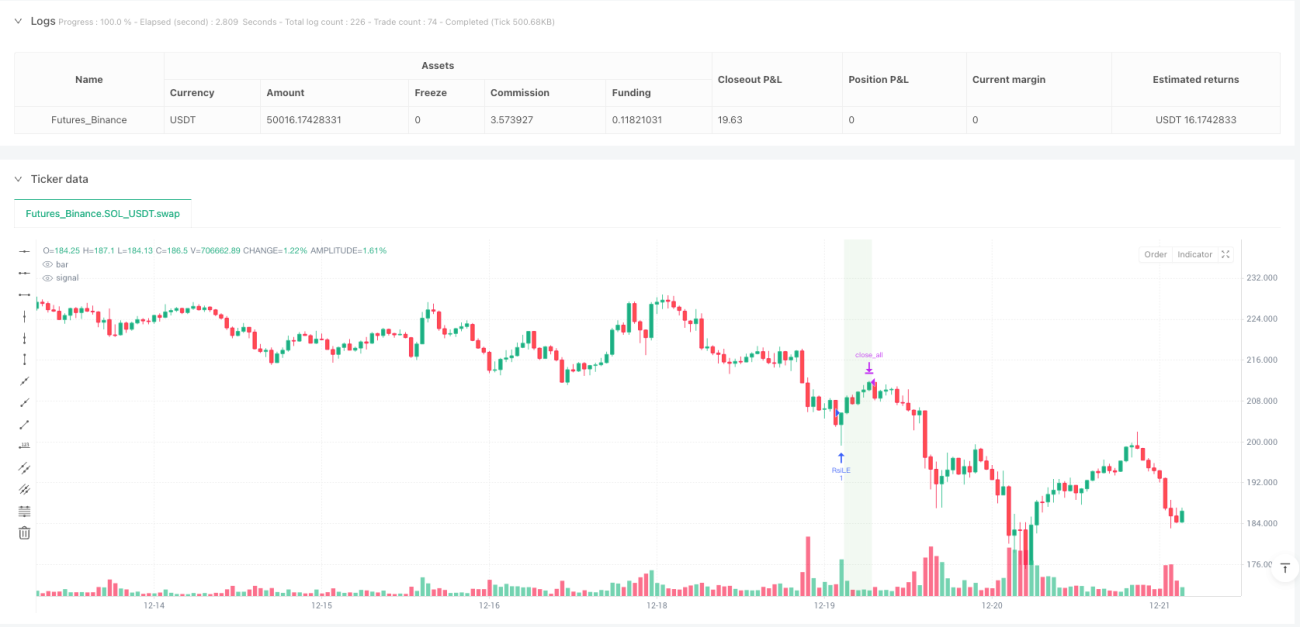
The Trading Hours RSI Crossover Dynamic Strategy is a lightweight intraday trading system designed specifically for equity index futures (such as Nasdaq NQ, S&P 500 ES, Dow Jones YM). Operating on a 30-minute timeframe chart, this strategy utilizes the Relative Strength Index (RSI) as its core technical indicator while strictly limiting trade execution to regular U.S. trading hours (08:30-15:00 Central Time, Monday to Friday). The system automatically enters long positions when RSI crosses above the oversold threshold and short positions when RSI crosses below the overbought threshold. To avoid overnight risk, all positions are automatically closed at the market closing time (15:00 CT). The strategy also offers optional background shading that highlights open long positions (green) and short positions (red).
Strategy Principles
The core principles of this strategy are based on the dynamic oscillation characteristics of the Relative Strength Index (RSI) and a strict trading session filtering mechanism:
-
RSI Signal Generation: The strategy employs the standard RSI indicator with a default period of 14 and customizable overbought (70) and oversold (30) thresholds. By monitoring RSI crossovers with these thresholds, entry signals are generated. The code uses
ta.crossover(vrsi, overSold)to detect when RSI crosses above the oversold threshold, triggering long entries, andta.crossunder(vrsi, overBought)to detect when RSI crosses below the overbought threshold, triggering short entries. -
Time Filtering System: The strategy implements a precise trading session control mechanism, executing trades only during regular U.S. market hours (08:30-15:00 CT, Monday to Friday). This is achieved through a combination of conditions:
- Weekday filter:
weekdayFilter = dayofweek >= dayofweek.monday and dayofweek <= dayofweek.friday - Time range filter: Calculating whether the current time is within the trading session, ensuring trades only occur during the 08:30-15:00 timeframe
- Weekday filter:
-
Forced Closing Mechanism: To avoid overnight risk, the strategy forcibly closes all positions at 15:00 on each trading day. The code triggers the closing command by checking if the current time has reached or exceeded the closing time:
strategy.close_all(comment="Close All by 15:00 CT"). -
Visual Assistance: The strategy provides optional background shading, displaying a green background when holding long positions and a red background when holding short positions, enhancing the intuitive perception of trading status.
Strategy Advantages
Analyzing the strategy code reveals the following significant advantages:
-
Focus on Intraday Trading: By limiting trading sessions and implementing forced closing mechanisms, the strategy completely avoids overnight risk, reducing potential gap risk and volatility risk associated with holding positions overnight.
-
Adaptation to Market Rhythm: RSI, as a reversal indicator, can effectively capture price reversal opportunities in overbought and oversold market conditions, particularly suitable for capturing short-term price fluctuations in intraday trading.
-
Parameter Adjustability: The strategy provides multiple customizable parameters, including RSI period length and overbought/oversold thresholds, allowing traders to optimize and adjust according to different market environments and personal risk preferences.
-
Clear Visual Feedback: The background shading feature provides intuitive position status display, allowing traders to understand their current position at a glance.
-
Concise and Efficient Code: The strategy implementation logic is clear, the code structure is streamlined, the computational burden is small, suitable for real-time execution, and will not cause system delays or performance issues.
-
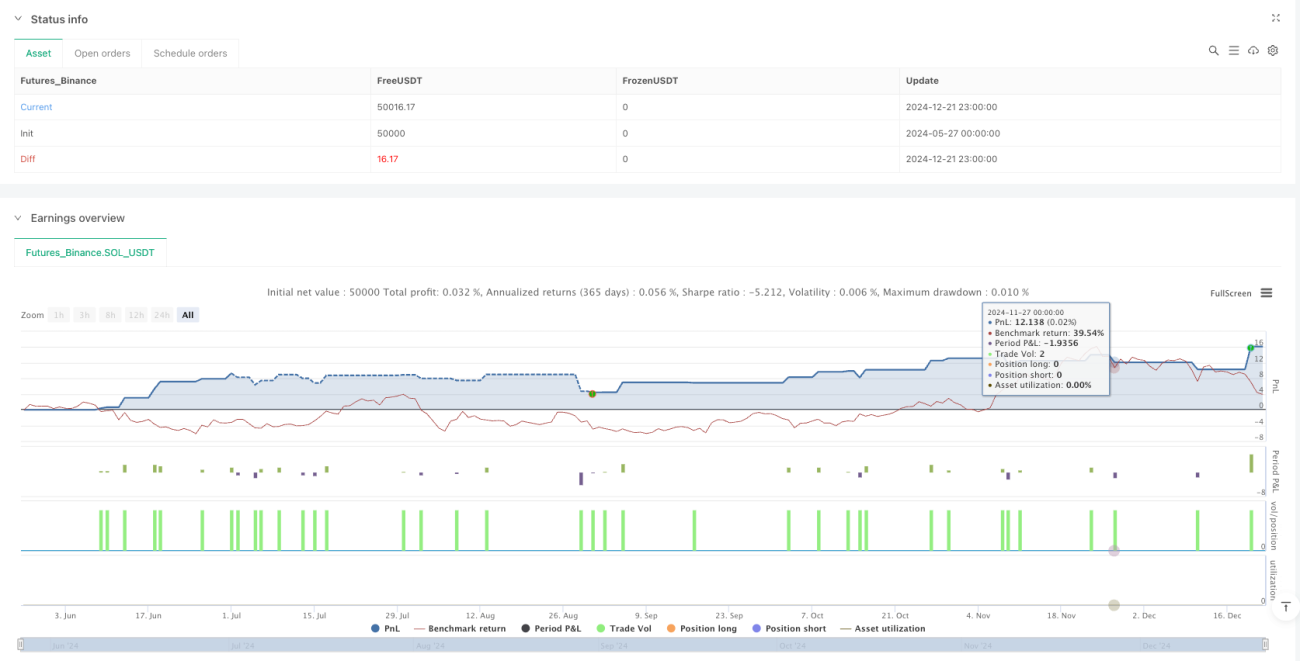
Stable Backtesting Performance: According to the provided backtesting data for the NQ June 2025 contract on a 30-minute timeframe, the strategy demonstrates a high profit factor (4.61) and acceptable win rate (57.1%), with maximum drawdown controlled within a reasonable range (0.22%).
Strategy Risks
Despite its many advantages, the strategy still has the following potential risks:
-
Limited Signal Frequency: RSI crossover signals may be relatively rare during intraday trading sessions, especially in clear market trends, potentially leading to insufficient trading opportunities and affecting overall returns. Solution: Consider adding supplementary indicators or adjusting RSI parameters to moderately increase signal frequency.
-
False Breakout Risk: The RSI indicator may produce false breakout signals, especially in markets with violent fluctuations but lacking clear direction. Solution: Add confirmation indicators or set additional filtering conditions, such as volume confirmation or trend direction filtering.
-
Time Zone Setting Sensitivity: The strategy relies on correct time zone settings; incorrect time zone configuration may cause the trading session filtering function to fail. Solution: Carefully check and verify time zone settings before live trading to ensure precise matching with target market trading times.
-
Lack of Stop-Loss Mechanism: The current strategy does not implement a dynamic stop-loss function, potentially facing significant losses under extreme market conditions. Solution: Implement volatility-based or fixed-point stop-loss mechanisms to limit maximum loss per trade.
-
Dependence on Fixed Closing Time: Forcing closure at 15:00 may cause missed potential reversal opportunities before market close or premature exit from favorable trends. Solution: Consider implementing more flexible closing strategies, such as deciding whether to close positions based on end-of-day trend status.
Strategy Optimization Directions
Based on in-depth analysis of the strategy code, the following are several feasible optimization directions:
-
Dynamic RSI Thresholds: Change fixed overbought and oversold thresholds to thresholds dynamically adjusted based on historical volatility or ATR (Average True Range) to adapt to volatility characteristics in different market environments. This allows for wider thresholds in high-volatility markets and narrower thresholds in low-volatility markets, improving signal quality.
-
Add Trend Filters: Introduce trend indicators (such as moving averages, MACD, or ADX) as directional filters, only opening positions in the main trend direction, avoiding frequent trading in ranging markets, and reducing false signals.
-
Implement Partial Position Closing Logic: Unlike the current all-or-nothing closing mechanism, implement a staged position closing strategy, such as closing part of the position when reaching certain profit targets while retaining part of the position to capture larger trends.
-
Add Volatility-Adjusted Position Sizing: Dynamically adjust position size based on market volatility (such as ATR), increasing positions in low-volatility markets and decreasing positions in high-volatility markets to optimize risk-reward ratios.
-
Integrate Volume Confirmation: On the basis of RSI signal generation, add volume confirmation conditions, executing trades only when supported by volume, improving signal reliability.
-
Implement Smart Stop-Loss Mechanisms: Introduce smart stop-loss mechanisms based on support/resistance levels or recent volatility ranges, replacing simple time-based closings for more effective risk control.
Summary
The Trading Hours RSI Crossover Dynamic Strategy is an elegantly designed intraday trading system that achieves efficient trading logic for equity index futures by combining the RSI technical indicator with strict trading session filtering. The core advantages of the strategy lie in avoiding overnight risk, capturing intraday overbought/oversold reversal opportunities, and providing clear visual feedback. Despite potential risks such as limited signal frequency and lack of dynamic stop-losses, the strategy's robustness and profitability can be significantly enhanced by implementing dynamic RSI thresholds, adding trend filters, and integrating volume confirmation. This strategy is particularly suitable for traders interested in intraday trading who seek to avoid overnight risk while capturing short-term price movement opportunities.
- 1