
Overview
The Momentum Trading Multi-Color Candle Recognition Quantitative Strategy is a price action-based trading system that utilizes color-coded candlesticks to identify short-term directional trading opportunities. This strategy is applicable across any timeframe, particularly performing well on 1-minute, 5-minute, and 15-minute charts. The core logic relies on specific color transition patterns, where yellow candles serve as signal candles, green or red candles act as entry confirmations, and blue candles function as early exit warning signals. This visual momentum strategy provides traders with clear entry and exit rules, helping to capture short-term market fluctuations.
Strategy Principles
The core principle of this strategy is to predict price trend continuation or reversal by observing color changes in candlesticks. Specifically:
-
Entry Logic:
- Buy Signal: When a green candle closes immediately after a yellow candle, indicating bullish continuation after a neutral/consolidation candle
- Sell Signal: When a red candle closes immediately after a yellow candle, indicating bearish continuation after a pause
-
Candle Color Definitions:
- Yellow Candle: Close is higher than open and previous candle's close is lower than its open
- Green Candle: Close is higher than open and close is higher than previous high
- Red Candle: Close is lower than open and close is lower than previous low
- Blue Candle: Close is lower than open with a volume spike
-
Exit Logic:
- Regular Exit: When a yellow candle appears or a candle of the opposite color to the entry direction closes
- Early Exit: If the early exit option is enabled, exit when a blue candle closes
- Stop Loss: Based on recent candle structure - for buy trades, SL is placed below the lower of yellow or green candles; for sell trades, SL is placed above the higher of yellow or red candles
The strategy is implemented through Pine Script, using boolean variables to track trade status and triggering entry and exit signals based on candle color changes.
Strategy Advantages
-
Simplicity and Intuitiveness: Using color coding makes the strategy easy to understand and execute, reducing the complexity of trading decisions.
-
High Adaptability: Can be applied to multiple timeframes and markets, providing good versatility.
-
Clear Rule System: Entry, exit, and stop-loss rules are clearly defined, reducing uncertainty from subjective judgment.
-
Integrated Risk Management: Built-in stop-loss mechanisms and optional early exit features help protect capital and lock in profits.
-
Momentum Capture Capability: Strategy design focuses on capturing short-term price momentum, helping to enter the market in the early stages of trend formation.
-
Customizability: Code structure allows traders to modify candle color conditions according to their needs, enhancing strategy flexibility.
-
Visual Feedback: By plotting buy and sell signal markers, it provides intuitive visual feedback, helping traders evaluate the quality of past signals.
Strategy Risks
-
False Signal Risk: In sideways or highly volatile markets, frequent false signals may occur, leading to consecutive losing trades. Mitigation: Additional filtering conditions can be added, such as volatility indicators or trend confirmation.
-
Parameter Sensitivity: Strategy performance may be highly sensitive to the specific parameters defining candle colors. Solution: Conduct comprehensive parameter optimization and backtesting to find parameter settings that perform consistently across different market conditions.
-
Overtrading: As the strategy is based on short-term price movements, it may lead to overtrading and increased transaction costs. Mitigation: Add time filters or set minimum holding time restrictions.
-
Stop-Loss Trigger Risk: In highly volatile markets, stop-losses may be frequently triggered, followed by price returning to the original direction. Solution: Consider using ATR-based dynamic stop-losses or optimize the stop-loss position calculation method.
-
Lack of Fundamental Considerations: Pure technical strategies ignore the impact of fundamental factors on price. Improvement: Incorporate filters for macroeconomic data releases or important news events.
-
Backtest Bias: Simulated color conditions may not accurately reflect actual trading environments. Countermeasure: Use actual trading data for forward testing and implement the strategy gradually.
Strategy Optimization Directions
-
Enhanced Signal Filtering:
- Integrate trend indicators (such as moving averages) to ensure trade direction aligns with the overall trend
- Add volatility filters to avoid trading in low-volatility environments
- Implementation method: Can add condition checks like
isUptrend = close > sma(close, 50)and use as an additional condition for buy signals
-
Optimize Stop-Loss Mechanism:
- Implement ATR-based dynamic stop-losses to better adapt to market volatility
- Introduce trailing stops to lock in profits
- Code example:
atr_value = ta.atr(14)anddynamic_sl = isLong ? entryPrice - atr_value * 2 : entryPrice + atr_value * 2
-
Improve Candle Recognition Logic:
- Optimize current color definition conditions to more accurately capture market states
- Consider adding more color categories to capture different market conditions
- For example, adding "purple" candles to represent high volatility but unclear direction states
-
Time Filtering:
- Implement trading time filters to avoid low liquidity or high volatility periods
- Add trading session restrictions to focus on the most active market periods
- Implementation example:
validTradingHour = (hour >= 9 and hour < 16)
-
Quantify Exit Criteria:
- Develop more sophisticated profit target mechanisms, such as based on support/resistance levels
- Implement partial profit strategies, exiting portions at different price levels
- Improvement method:
take_profit_level = isLong ? entryPrice * 1.02 : entryPrice * 0.98
-
Machine Learning Integration:
- Utilize machine learning algorithms to optimize candle color definitions and trading parameters
- Implement adaptive parameters that adjust dynamically based on market conditions
- This requires offline analysis and model training, then applying optimized parameters to the strategy
-
Risk Management Enhancement:
- Implement daily loss limits and maximum trade count
- Add position sizing logic based on risk percentage rather than fixed percentage
- Code implementation:
position_size = (account_balance * risk_percent) / (close - stopLoss)
Summary
The Momentum Trading Multi-Color Candle Recognition Quantitative Strategy provides a visually intuitive, rule-based trading method particularly suitable for capturing short-term price momentum. The strategy identifies signals through color-coded candlesticks, offering advantages of simplicity, clear rules, and integrated risk management. However, the strategy also faces risks such as false signals, overtrading, and parameter sensitivity.
By enhancing signal filtering, optimizing stop-loss mechanisms, improving candle recognition logic, and implementing more sophisticated exit strategies, the robustness and performance of the strategy can be significantly improved. In particular, integrating trend confirmation indicators and volatility filters will help reduce false signals, while dynamic stop-losses and partial profit mechanisms can improve risk-reward characteristics.
For traders seeking a visual, rule-based trading system, this multi-color candle strategy provides a solid foundation that can be further customized and optimized according to individual risk preferences and market conditions.
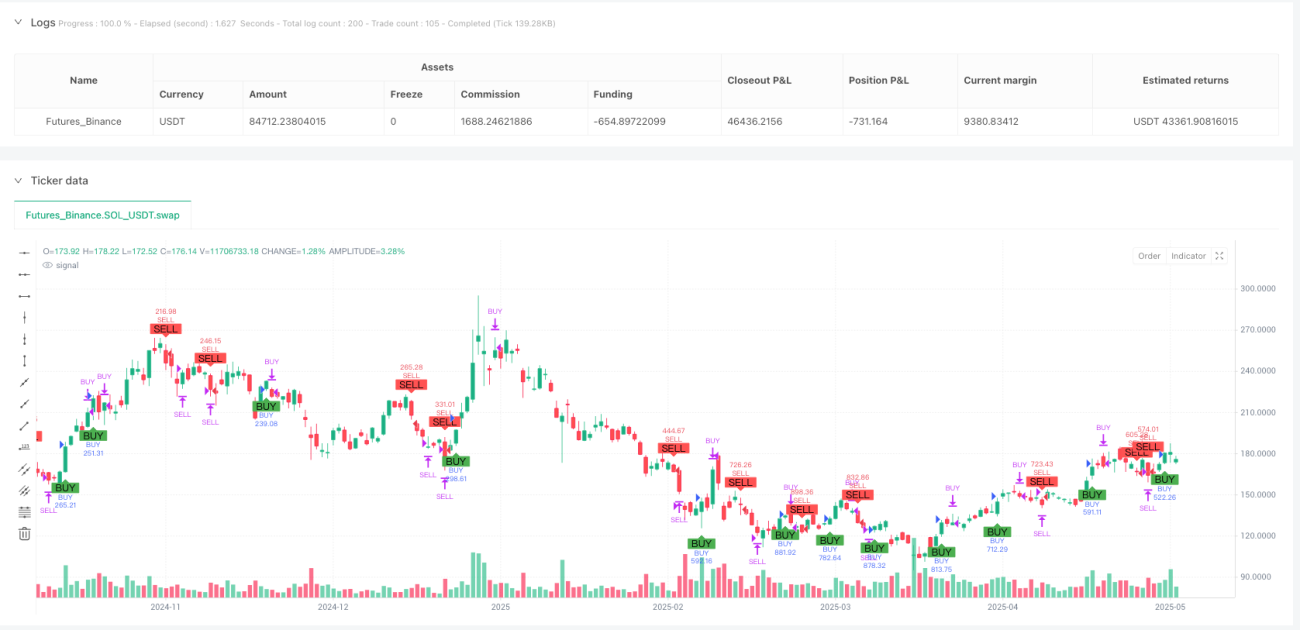
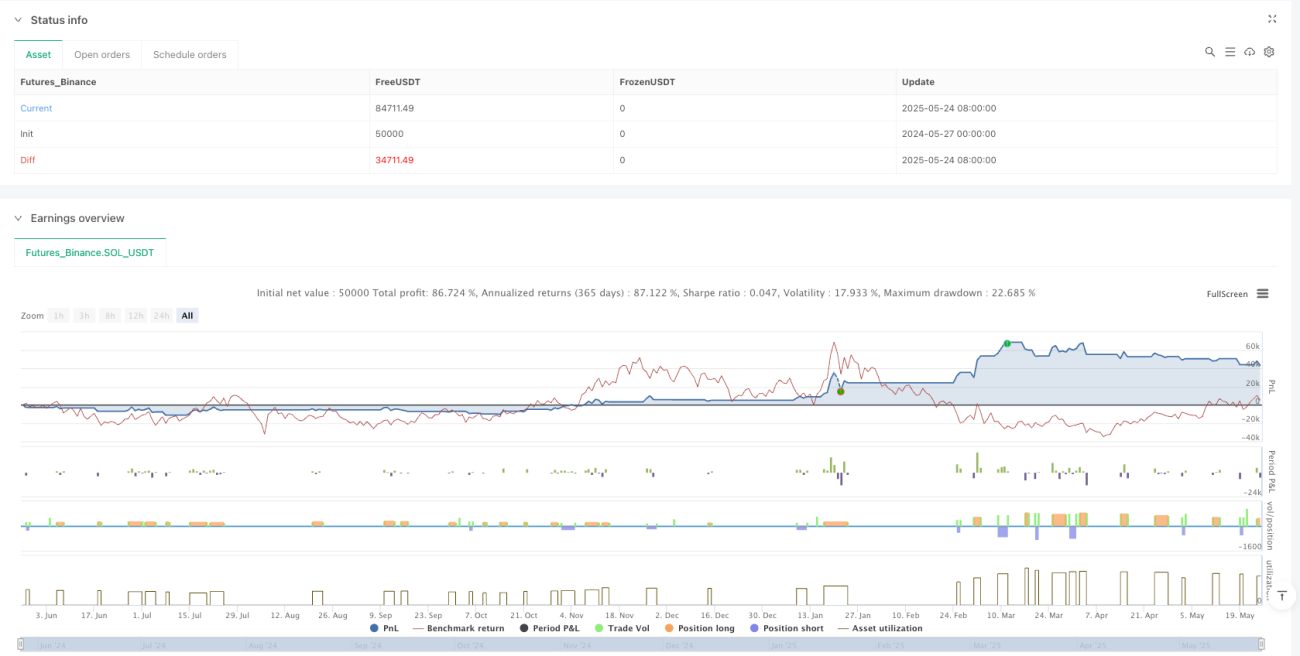
/*backtest
start: 2024-05-27 00:00:00
end: 2025-05-25 08:00:00
period: 1d
basePeriod: 1d
exchanges: [{"eid":"Futures_Binance","currency":"SOL_USDT"}]
*/

//@version=5
strategy("Color Candle Strategy", overlay=true, default_qty_type=strategy.percent_of_equity, default_qty_value=100)

/// === INPUTS === ///- 1