
Overview
The Multi-Dynamic Trend Strength Confirmation Trading Strategy is an advanced quantitative trading system that combines price action analysis with multiple technical indicators. This strategy integrates Exponential Moving Averages (EMA), MACD Histogram, Relative Strength Index (RSI), Average True Range (ATR), and volume signals to create a comprehensive framework for trend confirmation and entry signal generation. The core design revolves around W/M price pattern structures with dynamic filtering mechanisms, aiming to enhance the accuracy and reliability of trading signals while reducing risks associated with false signals.
Strategy Principles
The core principle of this strategy is to identify strong trends and precisely time entries through the confirmation of multiple technical indicators. The specific logic is as follows:
-
Trend Direction Confirmation: Uses 10-period and 15-period Exponential Moving Averages (EMA) as the foundational trend determination tools. Price above the EMA is considered an uptrend, while price below the EMA is considered a downtrend.
-
Momentum Shift Signal: Utilizes the MACD Histogram (rather than traditional MACD lines) crossing the zero line as a key signal for trend momentum shifts. The MACD Histogram crossing above zero indicates strengthening bullish momentum, while crossing below zero indicates strengthening bearish momentum.
-
Momentum Strength Validation: Verifies the current trend's momentum strength through the RSI indicator. An RSI value greater than 50 is seen as confirmation of upward momentum, while less than 50 confirms downward momentum.
-
Price Pattern Verification: Optionally uses pivot point analysis to identify W formations (higher lows) or M formations (lower highs), further confirming trend sustainability.
-
Volatility Filtering: Employs the ATR indicator multiplied by a custom multiplier to filter out market environments with insufficient volatility, avoiding signals when market movement is inadequate.
-
Volume Confirmation: Requires volume to exceed its moving average multiplied by a set threshold multiplier, ensuring sufficient market participation supports the price movement.
The combination of multiple confirmation mechanisms significantly improves signal quality. Buy signals require: price above EMA, MACD Histogram crossing above zero, RSI greater than 50, optional W formation confirmation, high volatility, and high volume. Sell signals require the opposite conditions.
Strategy Advantages
A deep analysis of the strategy's code implementation reveals the following significant advantages:
-
Multi-dimensional Signal Confirmation: Combines signals from trend (EMA), momentum (MACD, RSI), price patterns (pivot points), volatility (ATR), and market participation (volume) dimensions to form a comprehensive decision system, greatly reducing false signals.
-
Flexible Parameter Settings: The strategy provides rich adjustable parameters, including indicator periods, threshold multipliers, and confirmation mechanism enable/disable options, allowing traders to optimize according to different market environments and personal risk preferences.
-
Comprehensive Risk Management: Built-in take profit, stop loss, and trailing stop functions allow precise setting of risk-reward ratios and automated position risk management. The trailing stop is particularly suitable for capturing major trend movements, locking in existing profits while giving price sufficient breathing room.
-
Technical Integration Capability: Supports integration with external trading platforms (such as MT5) through Webhook functionality, enabling automated trading that reduces manual intervention and emotional influence.
-
Visual Decision Support: The strategy uses graphical markers, background highlights, and trendline drawing to visually present trading signals and market conditions, enhancing the intuitiveness of trading decisions.
-
Strong Adaptability: The strategy design accommodates various timeframes and trading instruments, adaptable to different market environments through parameter adjustments.
Strategy Risks
Despite its numerous advantages, the strategy also presents some potential risks and challenges:
-
Over-optimization Risk: The strategy includes multiple adjustable parameters, which can easily lead to over-optimization, making the strategy perform well on historical data but poorly in future live trading. The solution is to conduct robustness tests across multiple instruments and timeframes, and reserve some data for out-of-sample testing.
-
Signal Lag: Using indicators like EMA and MACD introduces inherent lag, potentially delaying entry timing, missing profit opportunities, or maintaining positions in the original direction during early trend reversals. Consider introducing leading indicators or reducing indicator periods to decrease lag.
-
Market Environment Dependence: This strategy performs better in clearly trending markets but may generate consecutive losses in range-bound or rapidly reversing market environments. It's advisable to optimize parameters under different market conditions or introduce market state recognition mechanisms to apply different parameter settings based on market state.
-
Multiple Conditions Limiting Trading Frequency: While multiple confirmation mechanisms improve signal quality, they may reduce trading frequency, missing potential profit opportunities. Consider setting layered signal conditions and determining position size based on the number of conditions met for more flexible capital management.
-
Webhook Dependency: Automated trading depends on Webhook connection stability; network issues or server failures may cause signal transmission failures. Setting up backup notification mechanisms, such as email or SMS alerts, ensures timely manual intervention when automated systems fail.
Strategy Optimization Directions
Based on in-depth code analysis, the strategy can be further optimized in the following aspects:
-
Adaptive Parameter Mechanism: Introduce adaptive parameter adjustment mechanisms that automatically adjust indicator parameters based on market volatility, trading cycles, or specific market phases to improve strategy adaptability. For example, automatically increase the ATR multiplier in high-volatility markets and lower threshold requirements in low-volatility markets.
-
Market State Classification: Add market state (trend/range) recognition mechanisms to use different signal generation logic and risk parameters in different market states. Market states can be objectively determined through indicators such as ADX or Bollinger Band width.
-
Intelligent Position Management: The current strategy uses a fixed percentage (10%) for position management, which could be improved to a dynamic position system based on volatility, signal strength, and expected win rate, increasing positions on more certain signals and reducing positions on higher uncertainty signals.
-
Multi-timeframe Analysis: Integrate multi-timeframe signal confirmation mechanisms, requiring trade direction to align with higher timeframe trends, improving trade success rates and reducing counter-trend trading.
-
Enhanced Machine Learning Optimization: Consider introducing machine learning algorithms such as random forests or neural networks to optimize the combination of multiple indicator signals, finding the most predictive indicator combinations and weight allocations.
-
Additional Price Action Confirmation: Add more price action analysis elements such as breakout confirmation, false breakout identification, and support/resistance testing to improve signal quality.
-
Improved Take-Profit/Stop-Loss Strategy: Dynamically set take-profit and stop-loss levels based on ATR or support/resistance levels, rather than using fixed points, making risk management more aligned with the current market environment.
Summary
The Multi-Dynamic Trend Strength Confirmation Trading Strategy is a well-designed quantitative trading system that constructs a comprehensive trading decision framework by integrating multiple technical indicators and price action analysis. Its core advantages lie in multi-dimensional signal confirmation, flexible parameter settings, and comprehensive risk management mechanisms, making it suitable for tracking medium to long-term trend movements.
The strategy's main risk points include parameter over-optimization and signal lag, but these issues can be effectively controlled through reasonable parameter settings and robustness testing. Future optimization directions should focus on developing adaptive parameter mechanisms, market state classification, and intelligent position management systems to further enhance the strategy's stability and profitability across different market environments.
Overall, this strategy represents the development direction of modern quantitative trading, effectively balancing signal quality and trading frequency through multi-factor models and systematic trading rules. It is a trading system worthy of in-depth research and practice. Through continuous optimization and live validation, this strategy has the potential to achieve stable risk-adjusted returns in various market environments.
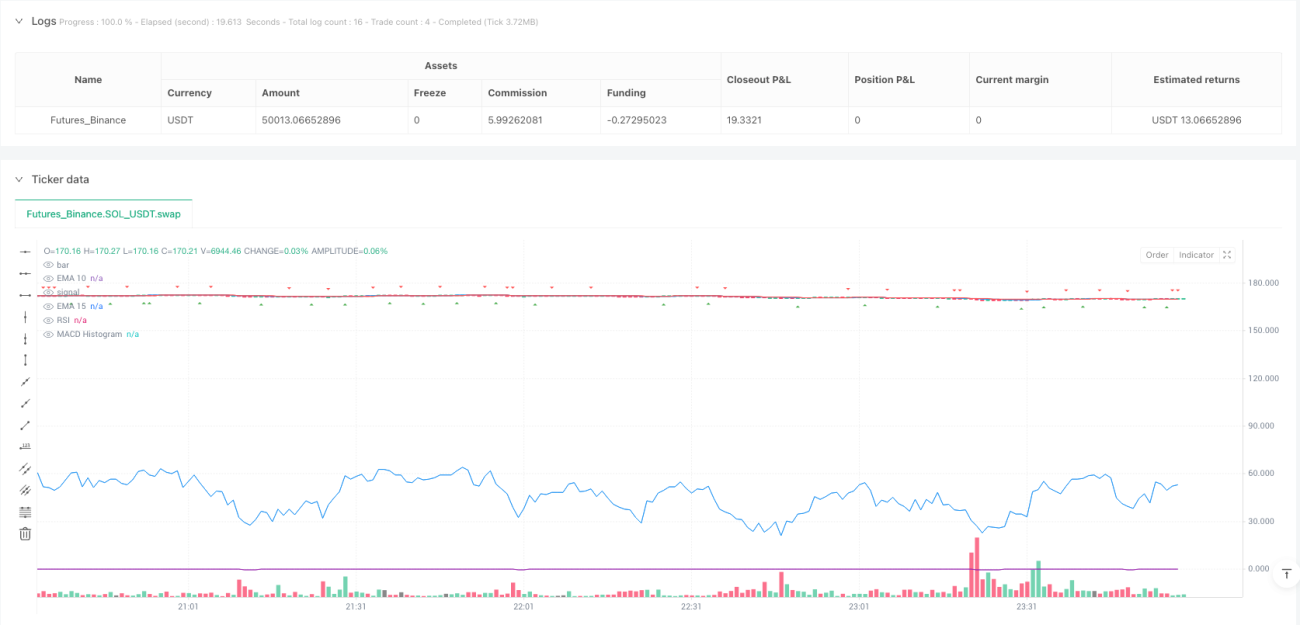
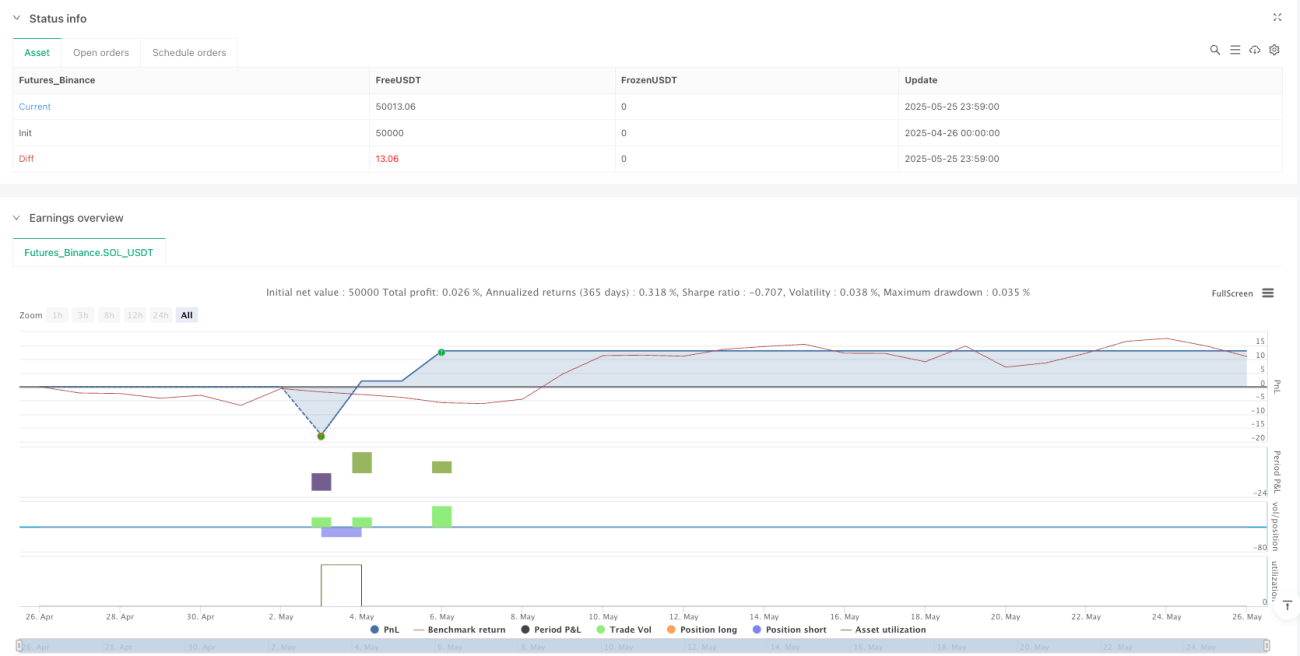
/*backtest
start: 2025-04-26 00:00:00
end: 2025-05-26 00:00:00
period: 1m
basePeriod: 1m
exchanges: [{"eid":"Futures_Binance","currency":"SOL_USDT"}]
*/

//@version=5
strategy("SpeedBullish Strategy Confirm V6.2", overlay=true, initial_capital=100000, default_qty_type=strategy.percent_of_equity, default_qty_value=10)

// ===== Input Parameters =====- 1